

Dermatologic diagnosis and monitoring have been dependent largely on visual grading. A skin biopsy is performed in case of diagnostic uncertainty, but can be traumatic, and results are delayed due to time for specimen transport and processing. Biopsies also destroy specimens, prohibiting lesion evolution monitoring. In vivo reflectance confocal microscopy (RCM) offers a diagnostic alternative to skin biopsy. RCM captures real-time, high-resolution images, and has been piloted for the evaluation of various dermatologic conditions. Identification of unique RCM features may distinguish dermatoses with similar clinical morphologies. Allergic contact dermatitis (ACD) and irritant contact dermatitis (ICD) are diagnosed by patch testing that currently uses a subjective scoring system. RCM has increasingly been studied for early detection and severity grading of CD. Common RCM features shared by ACD and ICD are stratum corneum disruption, vesicle formation, exocytosis, spongiosis, and parakeratosis. Features unique to ACD are vasodilation, increased epidermal thickness, intercellular edema, and acanthosis. Features unique to ICD are detached corneocytes and targetoid keratinocytes. This review summarizes the use of RCM in evaluating contact eccematous conditions and aims to spark future research and interest in this promising tool.
Tanto el diagnóstico como el seguimiento en la dermatología dependerán en gran medida de una evaluación visual. Cuando no se puede llegar al diagnóstico, se procede a realizar una biopsia cutánea, un procedimiento invasivo y que con frecuencia los resultados retrasan debido a la demora del transporte, así como al procesamiento de la muestra. Por otro lado, las biopsias pueden destruir las lesiones, lo que imposibilitará realizar un seguimiento clínico de la evolución de la lesión a estudio. La microscopia confocal de reflectancia in vivo (MCR) ofrece una alternativa diagnóstica a la biopsia cutánea. Esta técnica captura en tiempo real imágenes de alta resolución y se utilizará en la evaluación de diversas condiciones dermatológicas. La identificación de características específicas en la MCR podría ayudar a diferenciar dermatosis con una morfología clínica similar. La dermatitis alérgica de contacto (DAC) y la dermatitis irritativa de contacto (DIC) se diagnostican generalmente gracias a pruebas epicutáneas; estas, a su vez, se basarán en un sistema de valoración subjetiva. El uso de la MCR tanto en la detección temprana, como en la clasificación de la intensidad de la DC, ha sido estudiado en múltiples estudios. Existirán algunas características comunes en la MCR de la DAC como de la DIC. Entre estas podemos señalar la disrupción del estrato córneo, la formación de vesículas, la exocitosis, la espongiosis y la paraqueratosis. Las características específicas para la DAC serán la presencia de vasodilatación, el aumento del grosor epidérmico, edema intercelular y acantosis. Las características específicas de la DIC son la presencia de los corneocitos disgregados y queratinocitos en diana. Esta revisión resume la utilidad de la MCR en las condiciones eccematosas de contacto cutáneas y busca incentivar futuras investigaciones, así como incrementar el interés clínico en esta prometedora técnica.
In Vivo Reflectance Confocal Microscopy (RCM) is a non-invasive technique that captures live, instantaneous, high-resolution images of skin's ultrastructure. In 1957, mathematician and computer scientist Marvin Minksy patented the first confocal microscope for brain tissue imaging.1 RCM was later used for nuclear and cellular visualization of human skin by Rajadhyaksha and colleagues in 1995.2 From the late 1990s to 2010, published literature on RCM for dermatologic evaluations has increased by 20-fold, demonstrating the potential that RCM holds in dermatology.3
RCM utilizes a low power (<30 mW), tissue-sparing laser to capture real-time ultrastructural images that span the epidermis to the upper reticular dermis (up to 350μm depth).4 The commercial microscope includes laser light source (single laser: 830nm, or multi-laser: 488nm, 658nm, 785nm), scanning elements, relay telescope, beam splitter, pinhole aperture, objective lens, and detector (Figure 1A).4,5 When the light beam illuminates the skin, differences in refractance generate images of dark (non-reflecting) and bright (reflecting) structures within seconds.4 This corresponds to a boundary between two separate cellular structures that have different indices of refraction, including, but not limited to membranes, inflammatory debris, and melanosomes.4 Light is reflected back towards an objective lens. Prior, a pinhole aperture filters out scattered light to create a high-resolution image similar to conventional histology.4,5 Each image collected is viewed in a 500μm2 – 8mm2 field of view with 30X magnification. The device captures multiple images in two-dimensions with horizontal image stacking (Figure 1B), which differs from vertical sectioning of standard histopathology.5 Single laser RCM devices are handheld, conferring ease of use. Multi-laser devices combine fluorescent light spectrum microscopy and RCM. Fluorescent light spectrum microscopy augments the wavelength spectrum to identify more features of normal and pathologic skin. RCM has some advantages over dermoscopy as it can magnify cellular structures and features unique to each skin layer, and collect time-lapse photography to allow detection of dynamic skin changes.6 Additionally, detection of subclinical changes by RCM allows for early treatment implementation and prevents premature treatment termination.7 RCM imaging may also reduce participation commitment for both patients and clinicians.8
, tissue-sparing laser includes a laser light source, scanning elements, relay telescope, beam splitter, pinhole aperture, objective lens, and detector to generate images of dark and bright cutaneous structures. Figure 1B: Representative stacking of imaging, revealing characteristics from the epidermis to the upper reticular dermis.")
A A low power (<30 mW), tissue-sparing laser includes a laser light source, scanning elements, relay telescope, beam splitter, pinhole aperture, objective lens, and detector to generate images of dark and bright cutaneous structures.
Figure 1B: Representative stacking of imaging, revealing characteristics from the epidermis to the upper reticular dermis.
Approximately 20% of the U.S. population is affected by contact dermatitis (CD), which account for up to 95% of occupational dermatoses.9 Allergic contact dermatitis (ACD) occurs when contact with a particular substance elicits a delayed Type-IV hypersensitivity reaction that necessitates a 10-14 day sensitization phase. Upon allergen re-exposure, the reaction develops within 24-48hours. ACD manifests as pruritic, erythematous, scaly, edematous plaques with vesiculation at the sites of exposure.10 Histologically, ACD presents with vesicle formation, inflammatory infiltrate, and spongiosis.11–13
Whereas ACD requires prior exposure to elicit a cutaneous response, irritant contact dermatitis (ICD) can result from a singular exposure to an irritant. ICD presents with erythema, fissuring, and xerosis, typically with more burning and less itching than ACD.10 Histologically, ICD causes significant stratum corneum (SC) disruption, parakeratosis, and increased epidermal thickness. Despite differences in patho-etiology, ACD and ICD may have similar morphology, and are often difficult to distinguish based on visual inspection alone.14
Patch testing (PT) is the current gold standard to elicit CD, followed by clinician interpretation using the International Contact Dermatitis Research Group scoring system (Table 1). The scoring system has a sensitivity and specificity of 85%, with a 15-18% false-positive rate.15 Evaluation of cutaneous reactions is highly subjected to inter- and intra-grader variability. It is important to note that the same criteria are used for diagnosing both ACD and ICD, with no standardized parameter to differentiate the two. Thus, there is a practical need to provide more consistent and objective grading in CD. Figure 2
International Contact Dermatitis Research Group Scoring System.
| Symbol | Morphology | Assessment |
|---|---|---|
| - | No rxn. | Negative rxn. |
| ?+ | Faint erythema only | Doubtful rxn. |
| + | Erythema, infiltration, possibly papules | Weak positive rxn. |
| ++ | Erythema, infiltration, papules, vesicles | Strong positive rxn. |
| +++ | Intense erythema, infiltrate, coalescing vesicles | Extreme positive rxn. |
| IR | Various morphologies, eg. bulla, necrosis | Irritant rxn. |
Rxn, reaction
 at the level of the spinous layer (∼30 microns depth) shows spongiosis and exocytosis (yellow arrow) and multiple microvesicles with lymphocytes and detached keratinocytes (red arrow). Figure 2B: Irritant contact dermatitis: Reflectance confocal microscopy image (0.5×0.5mm) shows disruption of stratum corneum with detached corneocytes and early parakeratosis (yellow arrows) and confluence of microvesicles with inflammatory cells infiltration (red arrow) below.")
A Allergic Contact Dermatitis: Reflectance confocal microscopy image (0.5×0.5mm) at the level of the spinous layer (∼30 microns depth) shows spongiosis and exocytosis (yellow arrow) and multiple microvesicles with lymphocytes and detached keratinocytes (red arrow).
Figure 2B: Irritant contact dermatitis: Reflectance confocal microscopy image (0.5×0.5mm) shows disruption of stratum corneum with detached corneocytes and early parakeratosis (yellow arrows) and confluence of microvesicles with inflammatory cells infiltration (red arrow) below.
RCM has been used to distinguish eczematous conditions with similar morphologies.4 Early reaction detection by RCM may reduce the need for subsequent visits to grade delayed hypersensitivity reactions, and allow for early treatment implementation. In 2015, Hoogedoorn et al. briefly discussed ACD and ICD in their systematic review of the RCM literature on inflammatory skin diseases.16 Our updated in-depth review summarizes current evidence on the emerging use of RCM for diagnosis and monitoring of contact eczematous conditions, including ACD and ICD.
MATERIALS AND METHODSIn October 2017, two research personnel conducted a literature review to explore established RCM features of CD. PubMed and Google Scholar websites were searched using the terms ‘reflectance confocal microscopy’ AND ‘eczematous dermatoses,’ OR ‘dermatitis,’ OR ‘allergic contact dermatitis,’ OR ‘irritant contact dermatitis.’ These search parameters yielded a total of 49 papers. Literature selection was limited by publications or translations in the English language and randomized controlled trials (RCT). Three publications were excluded due to their primary discussion of laser scanning microscopy or fluorescence confocal microscopy. The 10 studies included in this review involved the use of RCM in RCT, and are summarized in Table 2.
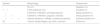
Summary of Reviewed Studies Evaluating RCM Features in ACD and ICD.
| Reference | Condition | Patient (N) | Allergens/ Irritants Used | RCM Features |
|---|---|---|---|---|
| Koller et al.17 | Unspecified CD | 20 CD lesions and 10 healthy controls | Not mentioned | RCM detected CD with 83% sensitivity and 92% specificityExocytosisEpidermal edemaDermal vasodilatationIntraepidermal vesicle formation |
| Gonzalez et al.18 | ACD | 5 | Nickel sulfate 5%, Balsam of Peru 25%, and Fragrance mix 8% | Immediate patch removal:VesiclesExocytosis of lymphocytes and Langerhans cells24hours post patch removal:Dendritic cellsParakeratosis48 and 72hours post patch removal:SC disruptionSpongiosisIncreased volume and diameter of dermal vasculature |
| Astner et al.7 | ACD | 16 | “Specific allergen” | SC disruptionParakeratosisSS spongiosis (sensitivity 100%, specificity 93%)SG spongiosis (sensitivity 96%, specificity 96%)Exocytosis (sensitivity 100%, specificity 74%)SS and SG vesicle formationSS and SG inflammatory infiltrate |
| Samhaber et al.19 | ACD | 12 | “Relevant allergen” | Epidermal spongiosisIncreased vascularizationSS and SG inflammatory infiltrateSS and SG microvesicles/vesiclesParakeratosis |
| Sakanashi et al.20 | ACD | 11 volunteers with contact allergy and 8 healthy volunteers | 5% nickel sulfate and 2% cobalt chloride | Increased suprabasal epidermal thicknessIntercellular edemaAcanthosisGreat vesicle formation |
| Astner et al.21 | ICD | 10 Caucasians and 10 healthy AA | Caucasians: 10% (threshold) and 5% (subthreshold) irritant solutionAA: 25% (threshold) and 20% (subthreahold) irritant solution | SC disruptionParakeratosisCorneocytesSpongiosisSS and SG vesicle formation |
| Hicks et al.22 | ICD | 8 Caucasians and 6 healthy AA | 1% SLS, 4% SLS | SpongiosisVesicle formationSC disruptionFocal parakeratosisExocytosisMicrovesicles containing inflammatory cells and detached keratinocytesPerivascular inflammatory infiltrate |
| Casari et al.23 | ICD | 10 | 5% SLS (Observed difference in RCM features following Vitamin E product application) | Compared to control, Vitamin E reduced the concentration of:Detached corneocytesTargetoid and bright keratinocytes (necrotic/apoptotic cells)Irregular keratinocyte architecture in the SS and SGIrregular rings in the DEJ |
| Benjamin et al.24 | ACD and ICD | 10 | 0.15% BACaq, 0.15% BACpet, 0.05% BECaq, 0.15% BECpet, 0.15% BECaq, 0.5% BECaq, 2% SLSaq | ACDSC disruption and parakeratosisMicrovesicle formation in the SS, SG, and DEJICDSC disruption and parakeratosisIncreased epidermal thickness |
| Astner et al.32 | ACD and ICD | 18 | 4% SLS and a specific allergen | ACD [Delayed and prolonged (96hours post-patch removal)]SG and SS microvesicle formationICD [Early (within 48hours post-patch removal)]SC disruptionExocytosisSpongiosisVesicle formationEpidermal necrosis |
Abbreviations: RCM: Reflectance Confocal Microscopy; CD: Contact Dermatitis; ACD: Allergic Contact Dermatitis; SC: Stratum Corneum; SS: Stratum Spinosum; SG: Stratum Granulosum; ICD: Irritant Contact Dermatitis; SLS: Sodium Lauryl Sulfate
Koller et al. evaluated the validity of RCM in diagnosing CD. Twenty CD lesions and 10 healthy tissue controls were confirmed by histology (n=9) or positive PT (n=11), and verified by three independent dermatologists who had moderate RCM grading experience. RCM detected CD with 83% sensitivity and 92% specificity and healthy skin with 97% sensitivity and 99% specificity. The authors attributed these statistical differences to more complex morphologic features in CD. Features present in CD RCM images were exocytosis, epidermal edema, and dermal vasodilatation. Intraepidermal vesicle formation in the upper epidermis and dermo-epidermal junction had high inter-observer agreement. When using these two features alone, classification tree software analysis accurately identified 82% of CD lesions. However, with only 20 CD lesions analyzed, it's unclear if these findings can be generalized to the overall population.17 The authors made no distinction between ACD and ICD. Nevertheless, the findings offer potential for further exploration comparing ACD and ICD reactions.17
Allergic Contact DermatitisGonzalez et al. published the first study on ACD using RCM involving 5 patients with a clinical history of ACD. This study aimed to investigate if the changes seen over time by histology can also be seen by RCM. Patches containing nickel sulfate 5%, balsam of Peru 25%, and fragrance mix 8% were placed for 24 and 48hours prior to removal. RCM images of reaction sites and adjacent skin were captured immediately, and at 24, 48, and 72hours post-patch removal. RCM-pathologic comparison was made with hematoxylin-eosin (H&E) staining of a 3mm skin biopsy taken 24hours after patch removal. Immediately upon patch removal, there were variably sized vesicles and exocytosis of lymphocytes and Langerhans cells, but no observable SC disruption. At 24hours post-patch removal, the SC remained intact but showed dendritic cells and parakeratosis. The most relevant features at 48 and 72hours post-patch removal included SC disruption, spongiosis, and at a depth of 56μm, increased volume and diameter (10-22μm) of dermal vasculature when compared to untreated skin (5-10μm). These RCM features were consistently observed on H&E-stained biopsy, supporting the notion that RCM can be used as an adjunct diagnostic tool. The authors mentioned that their study was limited by feature variability amongst the individuals and allergens,18 thus studies are needed to explore whether each allergens can elicit unique RCM features.
Despite the promising correlations Gonzalez et al. made between the ACD features on RCM and histopathology, the sensitivity of RCM in detecting ACD remained unknown. A pilot study by Astner et al. investigated the sensitivity of RCM for ACD in 16 patients with a history of skin allergy. Patches containing specific allergens and a phosphate-buffered saline solution control were placed for 48hours prior to removal. Clinical grading and RCM image grading was performed by three independent blinded observers using a presence-absence scheme; the clinical grading was performed at 48 and 72hours post-patch removal, and the RCM images were captured at 72hours post-patch removal. RCM identified ACD reactions as having stratum spinosum spongiosis, stratum granulosum spongiosis, and exocytosis (sensitivity 100%, 95.8%, and 100% respectively; specificity 92.6%, 96.3% and 74.1% respectively). To offset the simplicity of the presence-absence schema, logistic regression analysis indicated that the best predictor for ACD detection is the presence of stratum spinosum spongiosis, which positively correlated with stratum granulosum and stratum spinosum vesicle formation, stratum granulosum spongiosis, and stratum spinosum and stratum granulosum inflammatory infiltrate. Changes within the SC were the least sensitive for diagnosing ACD, a finding which has been confirmed in subsequent studies.7 In one of the participants, ACD from wool alcohols was detected by RCM at 72-hour post-patch removal when clinical evaluation was negative, suggesting that RCM was more sensitive than clinical evaluation. Three patients with borderline-positive clinical scores for their control sites had negative ACD changes on RCM, suggesting that RCM can also identify false-positive patch reads.7
Samhaber et al. identified characteristic RCM features of vesiculobullous skin disorders, including ACD. In 12 patients with at least one unequivocal ACD reaction to a relevant allergen, RCM images of 22 positive patch-induced ACD lesions were taken on day 3 or 4. In line with earlier reports, common RCM features were epidermal spongiosis, increased vascularization, and inflammatory infiltrate, most prominent in the stratum spinosum and stratum granulosum. In more severe reactions, microvesicles/vesicles were seen in 17 of the 22 patients within the stratum spinosum and stratum granulosum. Parakeratosis was noted in 8 ACD lesions and was always associated with numerous microvesicle/vesicles.19
To determine if there was a difference in allergic skin reaction from different reagents, Sakanashi et al. conducted a study involving 8 healthy volunteers and 11 patients with suspected contact allergy to dental metals. Patches containing aqueous solutions of 5% nickel sulfate (Ni) and 2% cobalt chloride (Co) were applied for 48hours. Clinical grading and RCM imaging were captured at baseline, and 20minutes, one day, and five days post-patch removal. Prior to PT, there was no difference in suprabasal epidermal thickness between patients and healthy volunteers. Ni- and Co-exposed skin on ACD patients had significantly increased suprabasal epidermal thickness compared to healthy volunteers at each time point evaluated, when compared to baseline. Notably, this change was appreciated at 20minutes following patch removal, suggesting that RCM can detect very early ACD changes before they become visually apparent. The Ni-positive group was further characterized by an overall increase in intercellular edema, acanthosis, and great vesicle formation, suggesting that there are allergen-specific differences. The authors postulate that Ni may induce a stronger keratinocyte proliferation response and T-cell recruitment. Among doubtful-positive Co reactions (n=3), RCM images of two patients only showed superficial SC disruption, and the third patient only had increased suprabasal epidermal thickness. The authors believe that RCM helped to distinguish between doubtful-positive and negative ACD reactions, which highlights the potential for RCM to precisely interpret true from doubtful ACD reactions. Further, this study suggest that various allergens may elicit different skin reactions that have distinct RCM features.20
Irritant Contact DermatitisTwo studies attempted to distinguish the variability of ICD in opposing Fitzpatrick skin types using RCM and investigate if subclinical irritant reactions can be detected by RCM. In a study by Astner et al. involving 10 healthy Caucasians (Fitzpatrick II/III) and 10 healthy African Americans (AA, Fitzpatrick V/VI), PT containing Ivory dishwashing liquid and distilled water as a negative control were placed for 24hours. Caucasians were exposed to 10% threshold and 5% subthreshold irritant solution, while AA were exposed to 25% threshold and 20% subthreshold irritant solution. Threshold was defined as the lowest irritant concentration to which a clinical reaction was detected, whereas subthreshold was defined as the highest irritant concentration to which a skin reaction was not clinically appreciated. The authors commented that the higher concentration needed to elicit erythema could either be due to difficulty in ascertaining erythema in deeply pigmented skin, and/or that AA skin is more durable when exposed to irritants. Clinical scoring, TEWL, and RCM imaging were performed at 24-hour post-patch removal. RCM features of ICD were observed in both groups of patients at threshold and subthreshold irritancy concentrations, and included SC disruption, parakeratosis, individual corneocytes, spongiosis, and stratum granulosum and stratum spinosum vesicle formation. RCM detected ICD features even when a visible clinical response was either absent or very subtle. This suggests lower irritant concentrations may be sufficient to elicit detectable cutaneous responses for PT in conjunction with RCM. On RCM analysis, Caucasians experienced significantly more severe SC disruption, epidermal spongiosis, and parakeratosis than AA. Caucasians also had dose-dependent TEWL increase, even in the absence of a visible clinical reaction. The authors further explained that AA's higher irritancy threshold and lower TEWL can be attributed to their increased number of SC cell layers and greater intercellular cohesiveness compared to Caucasian skin.21
In a study by Hicks et al. involving 8 Fitzpatrick II/III participants and 6 Fitzpatrick V/VI participants, PT containing 4% SLS for 6hours and 4% SLS, 1% SLS, and phosphate-buffered solution for 24hours was performed. Clinical evaluation, TEWL measurements, and RCM imaging were performed at 6, 24, and 48hours after initial application. In contrast to Astner et al.’s ethnicity study, AA had significantly less SC thickness than Caucasians, but only detectable at 4% SLS at 48hours. This suggests that AA may experience greater irritant-induced erosion compared to Caucasians. This contests the previous findings that deeply pigmented SC is more densely layered, as it is expected that thicker skin is less penetrable by SLS. Additionally, Caucasian's suprapapillary epidermal plate was thicker than that of AA when exposed to 4% SLS at 24 and 48hours, and 1% SLS at 48hours. This is possibly due to the more severe spongiosis and vesicle formation within the epidermis, and may explain the more severe clinical reaction seen in Caucasians. Interestingly, in both groups, positive RCM features were identified in exposed sites even when ICD reactions were not clinically evident. This further suggests that RCM is more sensitive for detecting ICD reactions than clinical examination in both darkly and lightly pigmented individuals.22
Vitamin E is an anti-oxidant that dampens irritation and stimulates repair mechanisms after irritation. Thus, Casari et al. aimed to determine whether such an anti-oxidant can affect ICD reactions, and if these changes could be identified through RCM. Three patches containing SLS 5% solution were placed on the volar forearm of 10 healthy subjects for 24hours. Vitamin E product (10% tocopherols, 0.3% tocotrienols) was applied at one site prior to SLS patch placement, one site post-SLS patch placement, and not at all at the third control site. TEWL measurements and RCM imaging were performed immediately, 30minutes, and 24hours after patch-removal. Immediately following patch removal, TEWL increased at control sites. At 48hours, vitamin E sites showed lower TEWL than the control sites. At 24hours there was significantly less detached corneocytes, targetoid keratinocytes, and irregular rings in the vitamin E area compared to control, suggesting that vitamin E's protective effect on irritancy was detectable through RCM. At 48hours, there were significantly less targetoid keratinocytes and irregular rings in the vitamin E compared to the control site. The authors did not correlate RCM features with a clinical scoring system. Nevertheless, this study demonstrates the utility and potential that RCM holds in monitoring dynamic lesions, especially those undergoing treatment.23
Comparing Allergic Contact Dermatitis and Irritant Contact DermatitisWith the shared and individual characteristics of ACD and ICD outlined in prior studies, there was a need to determine whether RCM can accurately differentiate ACD from ICD. Quaternary ammonium compounds (Quats) such as benzalkonium chloride (BAC) and benzathonium chloride (BEC) are known to elicit both allergic and irritant reactions, making it difficult to identify the true pathogenesis. Benjamin et al. attempted to distinguish ACD and ICD reactions using RCM. Eight subjects either with a history of prior positive PT to BAC (n=4), or a self-reported history of hand dermatitis after exposure to anti-bacterial skin products (n=4), and healthy controls (n=2) were enrolled. Patch testing containing BACaq [0.15% (aqueous vehicle)], BACpet [0.15% (petrolatum vehicle)], BECaq (0.05%), BECpet (0.15%), BECaq (0.15%), BECaq (0.5%), SLSaq (2%) positive irritant control, and deionized water negative control were placed for 48hours prior to removal. Clinical grading and RCM imaging were performed on days 4 and 7 post-patch removal. Similar to the findings in previous studies, RCM features of ACD included SC disruption and parakeratosis, microvesicle formation in the stratum granulosum, stratum spinosum, and dermo-epidermal junction. Clinically positive reactions for BACaq 0.15% (n=2) and BECaq 0.15% (n=1) resulted in ACD characteristics that were noted on RCM analysis. Positive clinical reactions for BECpet 0.15% (n=1) were read as ‘subtle changes’ on RCM; clinically positive reactions from BECaq 0.5% (n=2) were read as “possible” ACD. There were no clinical reactions that resulted from exposure to BACpet 0.15% or BECaq 0.05%.24 Among the 10 patients who were exposed to SLSaq 2.0%, 7 patients had positive clinical reactions, with SC disruption, parakeratosis, and increased epidermal thickness on RCM analysis. The data suggests that RCM can rectify that Quats are true allergens, rather than irritants.24
Another study by Astner et al. compared clinical grading to combined technical evaluation methods [RCM, TEWL and fluorescent excitation spectroscopy (FES)] in differentiating ACD and ICD. Eighteen individuals with a history of ACD received two patches containing 4% SLS, a specific allergen, a phosphate-buffered saline control, and negative control. Patches were removed 48hours later, and the participants returned at three or more time points (2, 3, 4, 9, 14, 21 days) following patch removal. At each visit, clinical grading by two independent observers, RCM evaluation, and TEWL were performed.14 An FES excitation/emission of 295/345nm corresponds to epidermal proliferation25–28 and/or increased cellular activity,29 whereas an excitation band at 270nm is consistent with inflammation.30 Significant stratum granulosum and stratum spinosum microvesicle formation, but not SC changes, peaked at 96-hours post-patch removal and persisted beyond the ninth day, indicating ACD reactions are prolonged. FES did not differ between ACD and control at either 278nm or 298nm, thus FES alone cannot distinguish between ACD reaction or no reaction. No significant correlation was observed between clinical scoring and TEWL measurements or RCM and TEWL, but it is unclear if RCM corresponds to clinical scoring. Despite insignificant correlation, peak in TEWL, a measure of SC disruption, was delayed to the 4th day post-patch removal. This suggests that SC disruption occurs much later in ACD lesions when compared to ICD reactions. It is possible that prior studies did not appreciate significant SC disruption in ACD lesions as readings were done within seven days.14 ICD reactions were detected by RCM within 48hours of patch removal, which is earlier than the identification of ACD reactions. RCM features include SC disruption, exocytosis, spongiosis, vesicle formation, and epidermal necrosis. In contrast to ACD, ICD reaction sites had an increase in FES at 278nm and 298nm, corresponding to increased inflammation, epidermal proliferation, and increased cellular activity, which correlated with increased spongiosis, parakeratosis, and hyperkaratosis characteristics of irritant reactions. It appears that FES can be used to detect presence of ICD reactions, but not ACD. Early reaction formation and resolution versus late reaction formation and resolution corresponds to ICD and ACD reactions by RCM, respectively. SC disruption, as identified via RCM and increase in TEWL and FES, is a key early structural change for irritant reactions that occur much later with allergen-exposure, and helps to distinguish between the two dermatoses.14
CONCLUSIONRCM is emerging as a valid modality for diagnosing cutaneous malignancies and inflammatory dermatoses that, in the past, necessitated biopsy or patch testing. RCM has a comparable sensitivity and specificity compared to patch testing for contact dermatitis (92% vs 85% specificity and 82% vs 85% sensitive, respectively). When compared to histology, RCM can identify SC disruption, parakeratosis, stratum spinosum spongiosis, stratum granulosum spongiosis, and exocytosis. Multiple studies have shown RCM is effective at diagnosing ICD in both light- and dark-skinned patients.
Research has demonstrated that RCM can augment current PT diagnosis of CD. RCM can detect sub-clinical ACD and ICD reactions. It can help distinguish between doubtful-positive and negative ACD reactions. RCM can detect pathological changes within minutes to a day when using patch testing. This early reaction detection could change how PT is performed in the future. RCM can be used to track dynamic changes in the skin, such as treatment process and resolution. It has been demonstrated that RCM can detect differences between ACD and ICD even when they appear morphologically similar, helping distinguish these two entities.
Many of the RCM devices used in the studies herein were traditional RCM (non-handheld) devices. These devices are limited by the imaging of curved skin surfaces on a live subject. Lateral movement is controlled with the use of a tissue ring-and-window device attached to both the skin and device however, breathing and minor movement create vertical motion artifact that may affect redundancy in stack image collection.31 Currently, hand held confocal devices reduce technical limitations of traditional RCM devices. Future generations of RCM devices can be improved to further address this technical limitation. An additional limitation for RCM is the cost, which is estimated to be 30,000 USD.
To date, studies have identified RCM features that can detect subclinical reactions to differentiate morphologically similar lesions (Table 3). Further studies should aim to examine the difference in ACD presentation in different Fitzpatrick types, much like what has been done for ICD. Studies are also needed to optimize RCM image protocol and laser settings that are most suitable for each condition, anatomical location, and Fitzpatrick skin type. Pilot studies are needed to identify RCM features in other inflammatory dermatoses in order to compare features among various erythematosquamous conditions.
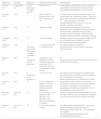
Summary of Reported RCM Features in ACD and ICD.
| ACD | ICD | |
|---|---|---|
| Disruption of SC | X | X |
| Spongiosis | X (particularly of SS) | X |
| Parakeratosis | X | X |
| Vesicle formation | X | X (microvesicles) |
| Exocytosis | X | X |
| Inflammatory cell infiltrate | X | X |
| Vasodilation | X | |
| Epidermal thickness | X | |
| Intercellular edema | X | |
| Acanthosis | X | |
| Detached corneocytes | X | |
| Targetoid keratinocytes | X |
Please cite this article as:.
. Microscopia confocal de reflectancia in vivo: papel emergente en el diagnóstico no invasivo, así como en el seguimiento de las dermatosis eccematosas Actas Dermosifiliogr. 2019;110:626–636.


www.publicationethics.org.
