


Non-alcoholic fatty liver disease (NAFLD) is one of the most frequent causes of liver disease in our region, with a strong association with metabolic factors, such as obesity and diabetes. Recent studies reported that NAFLD was 1.5–3 times more common in psoriatic patients.
ObjectivesTo calculate the diagnostic validity parameters of the triglyceride/glucose (TyG) index, and its combination with anthropometric parameters [body mass index (BMI), waist circumference (WC), and waist-to-height ratio (WHR)], as a non-invasive method for detecting NAFLD in patients with moderate-to-severe psoriasis.
MethodsWe conducted a cross-sectional and single-center study with 149 patients with moderate-to-severe psoriasis. The ROC curves and the area under the curve (AUC) were calculated for the TyG index along with different anthropometric measures, using transient elastography as the reference test. The optimal cut-off point was calculated using Youden's index.
ResultsThe prevalence of NAFLD was 64%. A total of 18% of these patients had significant liver fibrosis. The TyG index with anthropometric parameters showed a significant association with liver steatosis (P<.001). The TyG-BMI, TyG-WC, and TyG-WHR indices all showed an AUC>.83, while the TyG-BMI showed the highest AUC (0.852). Results were consistent in sex-based analyses.
ConclusionsThe TyG index with anthropometric parameters—especially BMI—is an effective method for the initial screening of NAFLD in psoriatic patients.
La enfermedad hepática grasa no alcohólica (EHGNA) es una de las principales causas de enfermedad hepática en nuestro medio, la cual se asocia fuertemente con factores de riesgo metabólicos como la obesidad y la diabetes. Estudios recientes han reportado que la EHGNA es de 1,5 a 3 veces más común en los pacientes con psoriasis.
ObjetivosCalcular los parámetros de validez diagnóstica del índice triglicéridos/glucosa (TyG), así como de su combinación con parámetros antropométricos (índice de masa corporal [IMC], perímetro de cintura [PC] y relación cintura/altura [CA]), como métodos no invasivos para la detección de EHGNA en los pacientes con psoriasis moderada/grave.
MétodosSe trata de un estudio transversal y unicéntrico que incluyó 149 pacientes con psoriasis moderada/grave. Se calcularon las curvas ROC y el área bajo la curva (AUC) para el índice TyG combinado con las distintas medidas antropométricas, utilizando la elastografía de transición como método de referencia. Para el cálculo del punto de corte óptimo se utilizó el índice de Youden.
ResultadosLa prevalencia de EHGNA fue del 64%, de los cuales el 18% presentó fibrosis hepática significativa. Los índices TyG combinados con parámetros antropométricos mostraron asociación significativa con la esteatosis hepática (p<0,001). Los índices TyG-IMC, TyG-PC y TyG-CA mostraron un AUC superior a 0,83, siendo el índice TyG-IMC el que mayor AUC obtuvo (0,852). Los resultados fueron consistentes en el análisis por sexo.
ConclusionesLos índices TyG combinados con parámetros antropométricos, especialmente con el IMC, son probablemente un método efectivo para el cribado inicial de EHGNA en los pacientes con psoriasis.

Non-alcoholic fatty liver disease (NAFLD) is one of the most prevalent chronic liver diseases in our setting and, in most cases, is closely linked to metabolic risk factors such as obesity, diabetes mellitus, or dyslipidemia.1 The prevalence of NAFLD has increased in recent years, reaching approximately 25–30% in the general population.2,3
NAFLD occurs 1.5–3 times more frequently in psoratic patients, with prevalences of up to 65% in some cohorts.1 Of note, this association is more evident in patients with severe psoriasis, regardless of other risk factors.1
Mantovani et al. proposed a hepato-cutaneous axis, where hepatic macrophages and psoriatic skin T cells produce pro-inflammatory cytokines that are released into the systemic circulation, playing a significant role in the pathogenesis of both diseases.4
Hepatic steatosis is diagnosed in the presence of fat deposition in ≥5% of hepatocytes. Although the gold standard test for diagnosis is histological examination through a liver biopsy, given that it is an invasive method and associates a high consumption of resources, it is necessary to look for other diagnostic methods for routine clinical practice. Transient elastography and the controlled attenuation parameter (CAP) have shown a good correlation with histological study.5
Imaging modalities such as abdominal ultrasound, magnetic resonance imaging, or hepatic transient elastography are a non-invasive alternative for the diagnosis of hepatic steatosis.6 However, these modalities are not usually available in the Dermatology consultation, and serological indices are useful for the initial assessment of the patient in the consultation. In fact, the NAFLD Fibrosis Score (NFS), FIB-4, or AST-to-Platelet Ratio Index (APRI) are widely used in the routine clinical practice as predictors of fibrosis in patients with NAFLD.7 However, non-invasive indices developed to diagnose steatosis, such as the Hepatic Steatosis Index (HSI) or the Fatty Liver Index (FLI), can be influenced by the presence of inflammation or fibrosis and are not as widely used, as they do not provide great advantages vs imaging modalities and routine blood tests.5
In this regard, 2 recent studies conducted in the United States evaluated the association of the TyG index with NAFLD and its predictive value. Their findings suggested that the TyG index along with anthropometric parameters is useful for the early diagnosis of NAFLD.8,9 However, these indices have not been specifically evaluated in psoriatic patients.
The main objective of this study is to evaluate and compare the diagnostic validity of the TyG index along with different anthropometric parameters in the diagnosis of NAFLD in patients with moderate/severe psoriasis eligible for systemic treatment.
Material and methodsStudy designWe conducted an analytical, observational, cross-sectional, and single-center study. The recruitment period started in May 2024 and ended in June 2024. Consecutive patients with moderate/severe psoriasis, older than 18 years who were eligible for systemic treatment who attended the Dermatology consultations of Hospital Clínico Universitario Lozano Blesa of Zaragoza, Spain, were included. This study did not have a control group of healthy patients.
Patients who refused to participate in the study, those younger than 18 years, and those with risky alcohol consumption, defined as consumption>20g/day in women and 30g/day in men, were excluded. In addition, patients with a diagnosis of hepatocellular carcinoma, patients who had received a liver transplant, or those with hepatitis due to hepatotropic viruses (B, C, and D), autoimmune hepatitis, or another type of liver disease other than NAFLD were not included.
All patients participated voluntarily and signed the informed consent form. Personal data were collected in a pseudonymized manner, in a database where the identity of the patients was replaced by consecutive numbers. In addition, this study has a favorable opinion for its realization by the Research Ethics Committee of Aragon (Code EOM24-017) and the Directorate of the Hospital Clínico Universitario Lozano Blesa of Zaragoza.
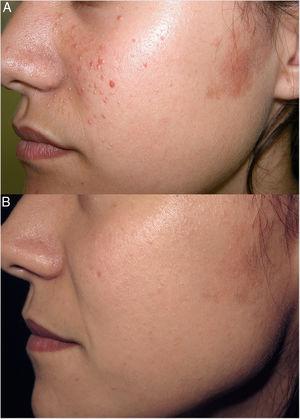
Study variablesThe main variable of the study was the triglyceride-glucose (TyG) index, and its combination with anthropometric parameters such as waist circumference (WC), waist-to-height ratio (WHtR), and body mass index (BMI). Both weight and height (for BMI calculation) and the rest of the anthropometric measurements were taken by the same researcher using the same instruments. Transient elastography collecting the controlled attenuation parameter (CAP, dB/m), which measures hepatic steatosis, and liver stiffness measured in kilopascals (kPa), which estimates the degree of hepatic fibrosis (Fig. 1), were used as the diagnostic test for reference liver disease. Other variables collected were age, sex, history of chronic diseases, and alcohol consumption, among others.
 Hepatic transient elastography in a patient with a healthy liver, showing a homogeneous distribution of low stiffness and attenuation by controlled parameter (CAP<248dB/m), indicative of the absence of steatosis. (B) Transient elastography in a patient with fatty liver, showing a heterogeneous distribution with areas of greater stiffness and an increase in CAP (343dB/m), associated with moderate-to-severe steatosis.")
(A) Hepatic transient elastography in a patient with a healthy liver, showing a homogeneous distribution of low stiffness and attenuation by controlled parameter (CAP<248dB/m), indicative of the absence of steatosis. (B) Transient elastography in a patient with fatty liver, showing a heterogeneous distribution with areas of greater stiffness and an increase in CAP (343dB/m), associated with moderate-to-severe steatosis.
Clinical data were collected from each patient's electronic medical record and completed with the personal clinical interview. Hepatic transient elastography was performed in fasting conditions by trained personnel, and the results were used as the gold standard for NAFLD and hepatic fibrosis. Only results from 10 valid measurements with an interquartile range/median<30% were considered adequate.
NAFLD was defined in case of CAP≥248dB/m and significant hepatic fibrosis in case of transient elastography≥8kPa.10,11
Statistical analysisStatistical analysis was performed using the SPSS® 22.0 (SPSS Ibérica, Madrid, Spain), Stata® 14 (StataCorp LLC, Texas, United States), and Jamovi 2.3.28 statistical packages.
In the initial descriptive analysis, qualitative variables were expressed as absolute frequencies and percentages. For quantitative variables, the mean and standard deviation were used for variables with a normal distribution, and the median and interquartile range for variables with a non-normal distribution.
To analyze the diagnostic validity of the TyG indices along with anthropometric measurements, ROC curves and the area under the curve (AUC) were calculated, using CAP and transient elastography values as the reference diagnostic test. Sex was considered as a possible confounding factor, so the AUC was also calculated for subgroups of men and women. The Youden index (sensitivity+specificity−1) was used to calculate the optimal cutoff point. Normality analyses were performed using the Kolmogorov–Smirnov test (normal distribution if p>0.05).
A p-value<0.05 was considered statistically significant. The necessary sample size was calculated with the Epidat 3.1 program (comparison of diagnostic tests). It was established that the expected value for the sensitivity and specificity of the test was 80%, with an expected disease prevalence of 55%, a 95% confidence level, and an absolute precision of 10%. The sample size estimated to obtain statistically significant results was 138 patients.
ResultsA total of 154 patients were initially recruited consecutively. Of these, a total of 5 participants were excluded from the final statistical analysis for meeting any of the exclusion criteria: 3 patients for chronic hepatitis C, 1 for autoimmune hepatitis, and 1 for primary biliary cholangitis. A total of 149 patients were included in the final statistical analysis.
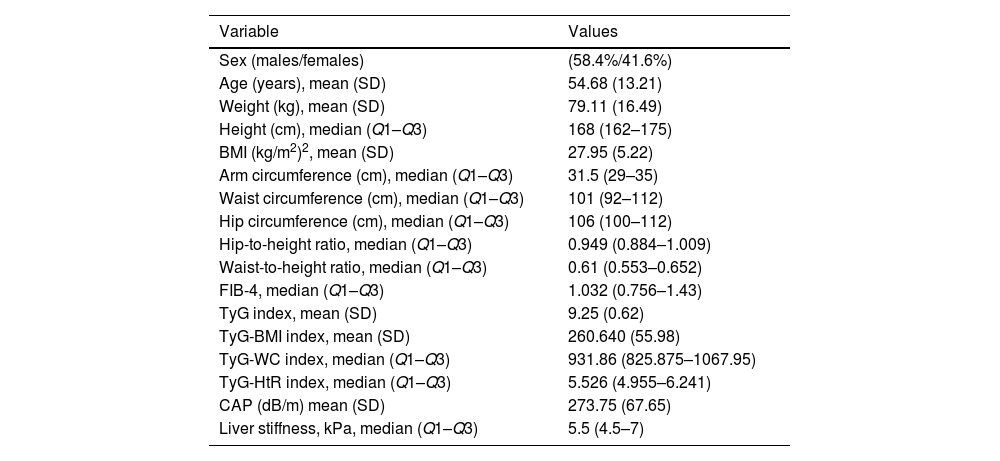
Sample descriptionA total of 58% of the patients were men (N=87) and 42% women (N=62). The mean age was 54.7 years with a standard deviation of 13.2 years. Table 1 shows the demographic data of the sample.
Demographic characteristics, anthropometric parameters, non-invasive indices, and CAP and liver stiffness values measured by transient elastography.
| Variable | Values |
|---|---|
| Sex (males/females) | (58.4%/41.6%) |
| Age (years), mean (SD) | 54.68 (13.21) |
| Weight (kg), mean (SD) | 79.11 (16.49) |
| Height (cm), median (Q1–Q3) | 168 (162–175) |
| BMI (kg/m2)2, mean (SD) | 27.95 (5.22) |
| Arm circumference (cm), median (Q1–Q3) | 31.5 (29–35) |
| Waist circumference (cm), median (Q1–Q3) | 101 (92–112) |
| Hip circumference (cm), median (Q1–Q3) | 106 (100–112) |
| Hip-to-height ratio, median (Q1–Q3) | 0.949 (0.884–1.009) |
| Waist-to-height ratio, median (Q1–Q3) | 0.61 (0.553–0.652) |
| FIB-4, median (Q1–Q3) | 1.032 (0.756–1.43) |
| TyG index, mean (SD) | 9.25 (0.62) |
| TyG-BMI index, mean (SD) | 260.640 (55.98) |
| TyG-WC index, median (Q1–Q3) | 931.86 (825.875–1067.95) |
| TyG-HtR index, median (Q1–Q3) | 5.526 (4.955–6.241) |
| CAP (dB/m) mean (SD) | 273.75 (67.65) |
| Liver stiffness, kPa, median (Q1–Q3) | 5.5 (4.5–7) |
SD: standard deviation; BMI: body mass index; TyG: triglyceride-glucose; TyG-BMI: TyG index combined with body mass index; TyG-WC: TyG index combined with waist circumference; TyG-HtR: TyG index combined with waist-to-height ratio; CAP: controlled attenuation parameter.
The prevalence of patients with hepatic steatosis was 64% (N=96). The prevalence of hepatic steatosis was significantly higher in men (71%) vs women (55%) (p<0.05). Similarly, patients with hepatic steatosis had a mean age of 58 years, significantly higher vs those without steatosis, whose mean age was 49 years (p<0.001).
Among patients with NAFLD, the prevalence of significant hepatic fibrosis was 18% (N=17). No statistically significant differences were observed between men and women or in the age of patients with and without significant hepatic fibrosis.
Diagnostic validity analysis of TyG index and its combinations with anthropometric measurementsThe TyG index along with BMI obtained the highest area under the curve, reaching 0.852; 95%CI (Fig. 2; Table 2). The optimal cutoff point for diagnosis was calculated with the Youden index, resulting in 243.27 (sensitivity, 0.802; specificity, 0.792). The results obtained for the AUC of the TyG index and the TyG indices along with anthropometric parameters were similar in both male and female groups (Figs. 3 and 4; Tables 3 and 4), although the AUC was slightly higher for all indices in the case of women.
 curve of the triglyceride and glucose index (TyG); triglycerides and glucose combined with body mass index (TyG-BMI); triglycerides and glucose combined with waist circumference (TyG-WC); triglycerides and glucose combined with waist-to-height ratio (TyG-HtR) of the sample.")
Receiver operating characteristic (ROC) curve of the triglyceride and glucose index (TyG); triglycerides and glucose combined with body mass index (TyG-BMI); triglycerides and glucose combined with waist circumference (TyG-WC); triglycerides and glucose combined with waist-to-height ratio (TyG-HtR) of the sample.
Area under the curve of the triglyceride and glucose index (TyG); triglycerides and glucose combined with body mass index (TyG-BMI); triglycerides and glucose combined with waist circumference (TyG-WC); triglycerides and glucose combined with waist-to-height ratio (TyG-HtR) of the sample.
| Area under the curve | 95% confidence interval | |||
|---|---|---|---|---|
| Studied indices | Area | Asymptotic significance | Lower limit | Upper limit |
| TyG index | 0.688 | 0.000 | 0.600 | 0.775 |
| TyG-BMI index | 0.852 | 0.000 | 0.789 | 0.914 |
| TyG-WC index | 0.832 | 0.000 | 0.764 | 0.899 |
| TyG-HtR index | 0.834 | 0.000 | 0.767 | 0.901 |
 curve of the triglyceride and glucose index (TyG); triglycerides and glucose combined with body mass index (TyG-BMI); triglycerides and glucose combined with waist circumference (TyG-WC); triglycerides and glucose combined with waist-to-height ratio (TyG-HtR) of the women in the sample.")
Receiver operating characteristic (ROC) curve of the triglyceride and glucose index (TyG); triglycerides and glucose combined with body mass index (TyG-BMI); triglycerides and glucose combined with waist circumference (TyG-WC); triglycerides and glucose combined with waist-to-height ratio (TyG-HtR) of the women in the sample.
 curve of the triglyceride and glucose index (TyG); triglycerides and glucose combined with body mass index (TyG-BMI); triglycerides and glucose combined with waist circumference (TyG-WC); triglycerides and glucose combined with waist-to-height ratio (TyG-HtR) of the men in the sample.")
Receiver operating characteristic (ROC) curve of the triglyceride and glucose index (TyG); triglycerides and glucose combined with body mass index (TyG-BMI); triglycerides and glucose combined with waist circumference (TyG-WC); triglycerides and glucose combined with waist-to-height ratio (TyG-HtR) of the men in the sample.
Area under the curve of the triglyceride and glucose index (TyG); triglycerides and glucose combined with body mass index (TyG-BMI); triglycerides and glucose combined with waist circumference (TyG-WC); triglycerides and glucose combined with waist-to-height ratio (TyG-HtR) of the women in the sample.
| Area under the curve | 95% confidence interval | |||
|---|---|---|---|---|
| Studied indices | Area | Asymptotic significance | Lower limit | Upper limit |
| TyG index | 0.725 | 0.002 | 0.599 | 0.851 |
| TyG-BMI index | 0.880 | 0.000 | 0.795 | 0.966 |
| TyG-WC index | 0.850 | 0.000 | 0.756 | 0.943 |
| TyG-HtR index | 0.859 | 0.000 | 0.768 | 0.951 |
Area under the curve of the triglyceride and glucose index (TyG); triglycerides and glucose combined with body mass index (TyG-BMI); triglycerides and glucose combined with waist circumference (TyG-WC); triglycerides and glucose combined with waist-to-height ratio (TyG-HtR) of the men in the sample.
| Area under the curve | 95% confidence interval | |||
|---|---|---|---|---|
| Studied indices | Area | Asymptotic significance | Lower limit | Upper limit |
| TyG index | 0.639 | 0.044 | 0.512 | 0.765 |
| TyG-BMI index | 0.823 | 0.000 | 0.730 | 0.915 |
| TyG-WC index | 0.807 | 0.000 | 0.706 | 0.909 |
| TyG-HtR index | 0.821 | 0.000 | 0.730 | 0.916 |
A ROC curve was calculated to assess the discriminatory capacity of the index in relation to hepatic fibrosis in patients with hepatic steatosis. An area under the curve of 0.598; 95%CI (p>0.05) was obtained. The optimal cutoff point was calculated using the Youden index, 260.99 (sensitivity, 0.824; specificity, 0.4).
DiscussionAs far as we know, this work is a pioneer in evaluating the diagnostic validity of TyG indices along with anthropometric parameters for the diagnosis of NAFLD in psoriatic patients. The results obtained for the TyG-BMI, TyG-WC, and TyG-HtR indices showed an AUC>0.83. Therefore, these indices could be a useful tool in the screening of NAFLD in psoriatic patients.
NAFLD is the leading cause of liver disease in our setting and has significant consequences on the vital prognosis of affected patients. Up to 30% will develop steatohepatitis, and of these, up to 20% will develop liver cirrhosis.12 NAFLD is the leading cause of liver transplantation in the United States in women and in elderly patients. In addition, it is one of the most frequent risk factors for hepatocellular carcinoma in Latin America.13 Considering that this disease is more prevalent in psoriatic patients vs the general population and the pathophysiological links they share, its evaluation within the comprehensive management of the psoriatic patient is recommended.
A total of 64% of our sample had hepatic steatosis, and 18% of the patients with steatosis had significant hepatic fibrosis. These results are consistent with the prevalence of hepatic steatosis in psoriatic patients reported in other cohorts, as well as with what has been described in other immune-mediated diseases such as inflammatory bowel disease1,14. In addition, the leading cause of mortality in patients with NAFLD is cardiovascular, so the detection of NAFLD in psoriatic patients should prompt us to rule out the presence of other cardiovascular risk factors.15
The main finding of this study was the AUC of the different TyG indices along with anthropometric parameters. The TyG index along with BMI showed the highest AUC, with a value of 0.852; 95%CI (0.789–0.914) for our entire cohort. These results were consistently reproduced in the stratified analysis by sex, with the TyG-BMI index having the highest AUC in both women and men. Our results contrast with those of other studies conducted in the US population, where the TyG-WC index had a higher AUC.9 Our work and the work conducted by Xue et al. agree that TyG indices combined with anthropometric parameters are an accurate method for the initial detection of hepatic steatosis. However, these indices had not been previously evaluated in psoriatic patients. In our study, both the TyG-WC and TyG-HtR indices showed AUC values>0.8. Although the best index may vary depending on the population, we know that if we combine the TyG index with the proposed anthropometric values, we will be able to screen patients with some certainty.
We did not perform any cost-effectiveness analysis to calculate the possible impact of the implementation of any of these indices as a screening method for hepatic steatosis. However, we can affirm that there was no added cost to the collection of data beyond that of routine clinical practice. To calculate the TyG index, only a blood test plus a liver and lipid profile are required, which is part of the routine follow-up of patients with moderate/severe psoriasis. Anthropometric measurements also do not involve any cost or require sophisticated technical support.
Regarding the limitations of our study, firstly, instead of using histopathology as the gold standard for the diagnosis of NAFLD and hepatic fibrosis, transient elastography was used. However, the latest generation transient elastography devices have proven to be effective in detecting steatosis>10%, in addition to correlating well with the severity of the condition. It is a simple, fast, comfortable, and reproducible technique. A 2019 study identified that the optimal cutoff point for diagnosing steatosis is 248dB/m.11
This work presents other limitations, inherent to its observational and cross-sectional design, such as the impossibility of establishing causality or studying the prognosis over time. In addition, the alteration of the TyG index could be related to the presence of other components of metabolic syndrome, not only to the presence of NAFLD per se. On the other hand, consecutive patients participated voluntarily in this study, which could imply a selection bias, so the sample in our study may not be representative of the population with moderate/severe psoriasis. Furthermore, this study did not have a control group of psoriatic patients, which limits the ability to make comparisons with healthy populations. The small sample size of patients with significant hepatic fibrosis may have also influenced the results.
Regarding the strengths of our study, firstly, transient elastography is used as the reference method, which to date has proven to be a useful, as well as widely available, inexpensive, and reproducible tool. Secondly, this is a pioneering study in investigating the role of the TyG index and its variants in psoriatic patients, with results similar to or better than other serological indices that have not been specifically evaluated in the psoriasis population.16,17 Thirdly, the prevalence of NAFLD obtained in our sample is consistent with other studies published in the literature and supports the need to develop simple and widely available strategies for its screening. Finally, our study evaluated and compared the AUC of the TyG index and the TyG index along with anthropometric parameters, not only in the general sample but also by subgroups of women and men, obtaining consistent results in the different subgroups.
ConclusionsThe TyG indices combined with anthropometric parameters showed an AUC>0.83, with the TyG-BMI index obtaining the highest AUC, with a value of 0.85. The calculation of the indices did not involve an added cost to routine clinical practice, so it could be an effective and efficient screening system for the detection of NAFLD in psoriatic patients.
FundingNone declared.
Conflicts of interestNone declared.