Psoriatic arthritis (PsA) is an inflammatory condition associated with psoriasis (PsO), with variable prevalence ranging from 6% to 42%. Despite the known link between PsO and PsA, reliable biomarkers for predicting PsA onset remain elusive. Recent research has identified risk determinants including obesity, onychopathy, PsO severity, and familial predisposition. Detecting PsO patients at risk of developing PsA is crucial given the disparity in treatment efficacy post-PsA establishment.
ObjectiveThis study evaluates the rate of PsA among PsO patients undergoing targeted biologic therapy as first- or second-line therapy.
Material and methodsWe conducted a retrospective cohort study utilizing TriNetX database and identified PsO patients receiving biologic therapy. Propensity score matching was applied to adjust for potential confounders. Patients were followed for 5 years, and the incidence rate of PsA was determined. Statistical analyses were performed to estimate relative risks and hazard ratios.
ResultsAmong 1,175,000 PsO patients, 41,990 received first-line biologic therapy. Following matching, patients initiating IL12/23i or IL23i exhibited a lower PsA incidence rate vs TNFi. Second-line IL12/23i and IL23i treatment also showed a lower PsA risk vs TNFi. IL17i did not significantly differ from TNFi in PsA risk.
ConclusionThis study highlights differential PsA risk among PsO patients on biologic therapy, suggesting potential benefits of IL12/23i and IL23i in PsA prevention. Prospective studies are needed to confirm these findings and optimize PsA prevention strategies.
Psoriatic arthritis (PsA) is an inflammatory arthropathy intricately linked with psoriasis (PsO). The prevalence of PsA exhibits notable variability from 6% to 42%, with an incidence rate of 2.7 per 100 patient-years.1 PsO stands as the foremost predisposing factor for PsA development, with 70–80% of PsA patients having exhibited PsO a decade prior to onset, on average.2
Despite advances in understanding the pathophysiology of PsA, identifying reliable biomarkers to predict its onset remains challenging. Zabotti et al.3 reviewed evidence on risk determinants for PsA, including obesity, onychopathy, PsO severity, and a family history of PsA. Additionally, the presence of unexplained joint pain and subclinical inflammation observed in the imaging modalities (ultrasound or magnetic resonance) can indicate a heightened risk of transitioning to PsA within a shorter timeframe, within 1–3 years.
The importance of identifying PsO patients at elevated risk of progressing to PsA arises from the observed disparity in treatment efficacy vs cutaneous signs, wherein fewer than 50% of patients achieve clinical remission once PsA has been established.4 These circumstances drive research into the feasibility of preventing PsA development or intercepting its progression.5 Given the established correlation between PsO severity and PsA risk,3 several investigations have explored the prospect of aggressive systemic therapies, such as biologic therapies, as potential preventive measures vs PsA development.1,6–13 In the current landscape, biologic therapies represent some of the most effective therapies for PsO. However, their capacity to prevent PsA onset and whether all mechanisms exert uniform effects, remain areas of active investigation.
The objective of this study was to compare the incidence of PsA among patients with PsO treated with targeted biologic agents, stratified by drug class and by use as first- or second-line therapy.
Material and methodsWe conducted a retrospective cohort study and examined data from the TriNetX Global Collaborative Network that provided access to electronic health records from 120 health care organizations spread across 17 countries.14 The analysis included data from 2010 (or before) up to December of 2023, selecting patients diagnosed with PsO (ICD-10-CM code L40) on biologic drugs. Exclusion criteria included prior biologic therapy or documented history of PsA (ICD-10-CM code L40.5) before the index date. The index date, which marks the beginning of the observation, was established when the patient started the first biologic agent after the diagnosis of psoriasis. Patients with failed cohort treatment and switched to a new therapy were not included in the final analysis.
The primary endpoint was defined as PsA diagnosis during follow-up, with patients censored upon this diagnosis or at follow-up termination without PsA, whichever occurred first. Statistical analysis employed Propensity Score 1:1 Matching (PSM) to adjust for sex, time since PsO diagnosis, obesity (BMI >30), alcohol/tobacco use, onychopathy, and prior conventional disease-modifying anti-rheumatic drugs (cDMARDs) use. All eligible TriNetX patients were included. Descriptive statistics were reported for clinical characteristics. Biologics were categorized into cohorts according to their mechanism of action [TNF inhibitors (TNFi), IL12/23 inhibitors (IL12/23i), IL17 inhibitors (IL17i) and IL 23 inhibitors (IL23i)], they were followed for 5 years and cumulative PsA incidence rate was calculated. The absolute risk reduction (ARR), expressed as the number of PsA cases avoided per 1000 patients, and the relative risk (RR) comparing PsA incidence rates between cohorts were calculated. The risk of developing PsA during follow-up was expressed as hazard ratios (HR) with 95% confidence intervals (CI), using first-line TNF inhibitor (TNFi) exposure as the reference.
Furthermore, the cumulative incidence rate of PsA was evaluated among the study cohorts (IL12/23i, IL23i and IL17i) in second-line patients (patients with previously failed TNFi), comparing them with the cohort of TNFi as first-line therapy. This analysis focused on the subsequent 3 years post-index date to maintain an adequate sample size.
Additionally, comparisons between the IL23i and IL17i cohorts, both naïve and second-line therapy, were conducted.
Our hospital records are reviewed to verify the accuracy of the data.
Initial cohort comparisons utilized the chi-square test (or Fisher's exact test) for categorical variables and t-Student test (or Wilcoxon's 2-sample rank sum test) for continuous variables. Time-to-event analysis employed Kaplan–Meier curves, with HRs calculated using multivariable Cox proportional analysis and significance assessed via the log-rank test.
Statistical analysis and data management were performed using SAS 9.4 software, with significance set at p<0.05.
ResultsWithin the global network, 1,175,000 patients PsO were identified, of whom 928,200 had no prior diagnosis of PsA. Among this subgroup, 41,990 patients received first-line targeted biologic therapy: TNFi (24,700 patients, 58.82%), IL12/23i (6020 patients, 14.33%), IL23i (5830 patients, 13.88%), and IL17i (5440 patients, 12.95%). Following PSM, patients available for comparison with TNFi treatment were 5640 for iIL23, 5480 for IL12/23i, and 4910 for iIL17.
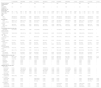
Table 1 illustrates the characteristics of adjusted and matched cohorts of patients with PsO initiating first-line biologic therapy who meet the selection criteria. Although patients show similarities in most variables, discrepancies in the incidence rate of liver disease and congestive heart failure are observed between the TNFi, IL12/23i, and IL17i cohorts.
Characteristics of adjusted and matched cohorts of patients with psoriasis without arthritis initiating first-line biological treatment.
| IL12/23i(5480) | TNFi(5480) | p-Value | IL17i(4910) | TNFi(4910) | p-Value | IL23i(5640) | TNFi(5640) | p-Value | IL23i(4730) | IL17i(4730) | p-Value | |
|---|---|---|---|---|---|---|---|---|---|---|---|---|
| Primary outcome events/person-years | 350 | 530 | – | 460 | 520 | – | 240 | 600 | – | 200 | 440 | – |
| Cumulative incidence of arthritis, per 100 person-years | 6.4 | 9.7 | – | 9.4 | 10.6 | – | 4.3 | 10.6 | – | 4.2 | 9.3 | – |
| Current age, years | 49±19.2 | 49.9±18.8 | 0.007 | 51.2±17.0 | 54.5±17.3 | <0.001 | 50.8±16.1 | 54.7±16.5 | <0.001 | 51.1±16.0 | 51.3±16.7 | 0.570 |
| Age at index, years | 44.1±18.6 | 43.8±18.3 | 0.355 | 48.2±16.8 | 48.4±16.8 | 0.495 | 48.7±16.1 | 48.6±16.2 | 0.884 | 48.9±16.0 | 48.2±16.5 | 0.032 |
| Sex | ||||||||||||
| Male | 2630 (48.0%) | 2620 (47.8%) | 0.848 | 2470 (50.3%) | 2430 (49.5%) | 0.419 | 2840 (50.4%) | 2860 (50.7%) | 0.706 | 2350 (49.7%) | 2380 (50.3%) | 0.537 |
| Female | 2790 (50.9%) | 2810 (51.3%) | 0.702 | 2360 (48.1%) | 2410 (49.1%) | 0.313 | 2730 (48.4%) | 2720 (48.2%) | 0.851 | 2320 (49.0%) | 2290 (48.4%) | 0.537 |
| Race/ethnicity | ||||||||||||
| White | 3930 (71.7%) | 3920 (71.5%) | 0.832 | 3210 (65.4%) | 3480 (70.9%) | <0.001 | 3910 (69.3%) | 3890 (69.0%) | 0.683 | 3360 (71.0%) | 3110 (65.8%) | <0.001 |
| Black or African American | 350 (6.14%) | 420 (7.6%) | 0.009 | 370 (7.5%) | 390 (7.9%) | 0.450 | 330 (5.9%) | 410 (7.3%) | 0.002 | 280 (5.9%) | 350 (7.4%) | 0.004 |
| Asian | 180 (3.3%) | 160 (2.9%) | 0.270 | 250 (5.1%) | 130 (2.6%) | <0.001 | 280 (5.0%) | 150 (2.7%) | <0.001 | 260 (5.5%) | 240 (5.1%) | 0.358 |
| Other or not available | 770 (14.1%) | 760 (13.9%) | 0.728 | 800 (16.3%) | 660 (13.4%) | <0.001 | 670 (11.9%) | 750 (13.3%) | 0.023 | 580 (12.3%) | 760 (16.1%) | <0.001 |
| Comorbidities before the index date | ||||||||||||
| Overweight, obesity and other hyperalimentation | 910 (16.6%) | 880 (16.1%) | 0.438 | 1010 (20.6%) | 1010 (20.6%) | 1 | 1270 (22.5%) | 1250 (22.2%) | 0.651 | 1000 (21.1%) | 1000 (21.1%) | 1 |
| Obesity (body-max index >30kg/m2) | 1090 (19.9%) | 1050 (19.1%) | 0.335 | 1180 (24.0%) | 1200 (24.4%) | 0.638 | 1210 (21.5%) | 1190 (21.1%) | 0.645 | 1090 (23.0%) | 1090 (23.0%) | 1 |
| Tobacco use or tobacco use disorder | 530 (9.7%) | 530 (9.7%) | 1 | 600 (12.2%) | 570 (11.6%) | 0.350 | 700 (12.4%) | 680 (12.1%) | 0.566 | 560 (11.8%) | 570 (12.1%) | 0.751 |
| Alcohol related disorders | 170 (3.1%) | 190 (3.5%) | 0.283 | 220 (4.5%) | 200 (4.1%) | 0.319 | 270 (4.8%) | 230 (4.1%) | 0.067 | 200 (4.2%) | 210 (4.4%) | 0.614 |
| Onycholysis | 50 (0.9%) | 30 (0.5%) | 0.024 | 40 (0.8%) | 40 (0.8%) | 1 | 60 (1.1%) | 40 (0.7%) | 0.045 | 30 (0.6%) | 40 (0.8%) | 0.230 |
| Chronic obstructive pulmonary disease | 190 (3.5%) | 180 (3.3%) | 0.597 | 220 (4.5%) | 230 (4.7%) | 0.629 | 220 (3.9%) | 260 (4.6%) | 0.062 | 180 (3.8%) | 220 (4.7%) | 0.041 |
| Congestive heart failure | 170 (3.1%) | 120 (2.2%) | 0.003 | 220 (4.5%) | 150 (3.1%) | <0.001 | 230 (4.1%) | 180 (3.2%) | 0.012 | 180 (3.8%) | 220 (4.7%) | 0.041 |
| Diabetes mellitus | 640 (11.7%) | 630 (11.5%) | 0.765 | 740 (15.1%) | 740 (15.1%) | 1 | 790 (14.0%) | 870 (15.4%) | 0.033 | 660 (14.0%) | 720 (15.2%) | 0.081 |
| Liver disease | 280 (5.1%) | 370 (6.8%) | <0.001 | 320 (6.5%) | 370 (7.5%) | 0.048 | 410 (7.3%) | 420 (7.4%) | 0.718 | 330 (7.0%) | 310 (6.6%) | 0.413 |
| Renal disease | 170 (3.1%) | 190 (3.5%) | 0.248 | 170 (3.5%) | 190 (3.9%) | 0.283 | 190 (3.4%) | 220 (3.9%) | 0.131 | 160 (3.4%) | 160 (3.4%) | 1 |
| DMARDs before the index date | ||||||||||||
| Methotrexate | 650 (11.9%) | 630 (11.5%) | 0.552 | 480 (9.8%) | 470 (9.6%) | 0.733 | 450 (8.0%) | 440 (7.8%) | 0.727 | 410 (8.7%) | 420 (8.9%) | 0.716 |
| Cyclosporine | 210 (3.8%) | 150 (3.5%) | 0.308 | 210 (4.3%) | 200 (4.1%) | 0.614 | 200 (3.5%) | 180 (3.2%) | 0.297 | 180 (3.8%) | 170 (3.6%) | 0.586 |
| Acitretin | 170 (3.1%) | 130 (2.4%) | 0.019 | 170 (3.5%) | 120 (2.4%) | 0.003 | 130 (2.3%) | 90 (1.6%) | 0.006 | 130 (2.7%) | 130 (2.7%) | 1 |
| Apremilast | 0 (0%) | 0 (0%) | – | 0 (0%) | 0 (0%) | – | 0 (0%) | 0 (0%) | – | 0 (0%) | 0 (0%) | – |
| Upadacitinib | 0 (0%) | 0 (0%) | – | 0 (0%) | 0 (0%) | – | 0 (0%) | 0 (0%) | – | 0 (0%) | 0 (0%) | – |
| Tofacitinib | 0 (0%) | 0 (0%) | – | 0 (0%) | 0 (0%) | – | 0 (0%) | 0 (0%) | – | 0 (0%) | 0 (0%) | – |
| Deucravacitinib | 0 (0%) | 0 (0%) | – | 0 (0%) | 0 (0%) | – | 0 (0%) | 0 (0%) | – | 0 (0%) | 0 (0%) | – |
| DMARDb after the index date | ||||||||||||
| TNF inhibitor | ||||||||||||
| Adalimumab | 0 (0%) | 3450 (63.0%) | <0.001 | 0 (0%) | 3190 (65.0%) | <0.001 | 0 (0%) | 3710 (65.8%) | <0.001 | 0 (0%) | 0 (0%) | – |
| Etanercept | 0 (0%) | 1340 (24.5%) | <0.001 | 0 (0%) | 1150 (23.4%) | <0.001 | 0 (0%) | 1270 (22.5%) | <0.001 | 0 (0%) | 0 (0%) | – |
| Infliximab | 0 (0%) | 810 (14.8%) | <0.001 | 0 (0%) | 630 (12.8%) | <0.001 | 0 (0%) | 710 (12.6%) | <0.001 | 0 (0%) | 0 (0%) | – |
| Certolizumab | 0 (0%) | 120 (2.2%) | <0.001 | 0 (0%) | 120 (2.4%) | <0.001 | 0 (0%) | 140 (2.5%) | <0.001 | 0 (0%) | 0 (0%) | – |
| Golimumab | 0 (0%) | 70 (1.3%) | <0.001 | 0 (0%) | 80 (1.6%) | <0.001 | 0 (0%) | 80 (1.4%) | <0.001 | 0 (0%) | 0 (0%) | – |
| IL12/23 inhibitor | ||||||||||||
| Ustekinumab | 5480 (100%) | 0 (0%) | <0.001 | 0 (0%) | 0 (0%) | – | 0 (0%) | 0 (0%) | – | 0 (0%) | 0 (0%) | – |
| IL17 inhibitor | ||||||||||||
| Secukinumab | 0 (0%) | 0 (0%) | – | 2750 (56.0%) | 0 (0%) | <0.001 | 0 (0%) | 0 (0%) | – | 0 (0%) | 2670 (56.4%) | <0.001 |
| Ixekizumab | 0 (0%) | 0 (0%) | – | 2160 (44.0%) | 0 (0%) | <0.001 | 0 (0%) | 0 (0%) | – | 0 (0%) | 2070 (43.8%) | <0.001 |
| Brodalumab | 0 (0%) | 0 (0%) | – | 70 (1.4%) | 0 (0%) | <0.001 | 0 (0%) | 0 (0%) | – | 0 (0%) | 70 (1.5%) | <0.001 |
| IL23 inhibitor | ||||||||||||
| Guselkumab | 0 (0%) | 0 (0%) | – | 0 (0%) | 0 (0%) | – | 2130 (37.8%) | 0 (0%) | <0.001 | 1790 (37.8%) | 0 (0%) | <0.001 |
| Tildrakizumab | 0 (0%) | 0 (0%) | – | 0 (0%) | 0 (0%) | – | 210 (3.7%) | 0 (0%) | <0.001 | 190 (4.0%) | 0 (0%) | <0.001 |
| Risankizumab | 0 (0%) | 0 (0%) | – | 0 (0%) | 0 (0%) | – | 3330 (59.0%) | 0 (0%) | <0.001 | 2780 (58.8%) | 0 (0%) | <0.001 |
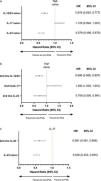
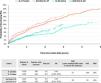
Regarding the onset of PsA cases, naïve patients treated with IL12/23i and IL23i demonstrated lower PsA incidence compared to TNFi, with a RR of 0.66 (0.58–0.75) and 0.40 (0.35–0.46), an ARR of 64 and 33 cases of PsA avoided/1000 patients and HR 0.678 (0.593, 0.777) and 0.579 (0.496, 0.657 respectively. Conversely, the difference in PsA incidence between IL17i and TNFi was not significant (Figs. 1a and 2).

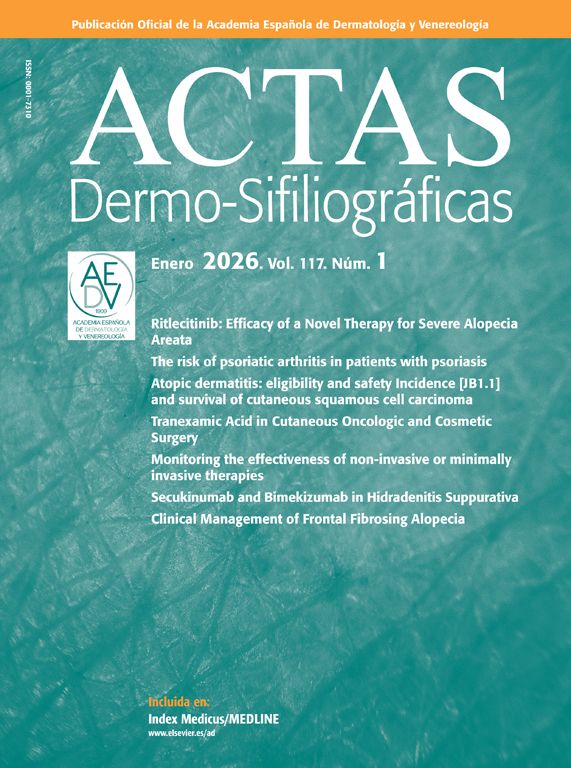
Forest plot depicting adjusted HRs for time to psoriatic arthritis for patients with psoriasis without arthritis initiating some first-line biologic therapy (a), patients with psoriasis without arthritis initiating treatment with IL12/23i, IL17i, or IL23i as second-line therapy vs those on TNFi as first-line therapy (b) and patients with psoriasis without arthritis initiating treatment with IL17i and IL23i as both first- and second-line therapies.

Regarding the onset of PsA, biologic-naïve patients treated with IL12/23 inhibitors (IL12/23i) or IL23 inhibitors (IL23i) demonstrated a lower rate of PsA vs those on TNF inhibitors (TNFi), with relative risks (RR) of 0.66 (95% CI, 0.58–0.75) and 0.40 (95% CI, 0.35–0.46), respectively. The corresponding ARRs were 64 and 33 PsA cases avoided per 1000 patients, and HR were 0.678 (95% CI, 0.593–0.777) and 0.579 (95% CI, 0.496–0.657), respectively. Conversely, the difference in PsA incidence between IL17i and TNFi was not statistically significant (Figs. 1a and 2).
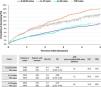
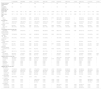
Table 2 illustrates the characteristics of cohorts of PsO patients without arthritis initiating second-line therapy with IL12/23i, IL17i, or IL23i vs those on first-line TNFi. No significant differences were detected in baseline characteristics across these groups. The incidence rate of new cases of PsA during a 3-year follow-up was also lower in the IL12/23i and IL23i groups vs the TNFi group, with RR of 0.76 (0.62–0.93) and 0.60 (0.44–0.82), an ARR of 19 and 40 cases avoided/1000 patients and HR of 0.696 (0.565, 0.857) and 0.708 (0.506, 0.991), respectively (Figs. 1b and 3). This differentiation was not observed in the group of patients on iIL17, in which the risk of developing PsA was higher vs TNFi as first-line therapy (Fig. 3), with HR of 1.2 (1.039, 1.601).
Characteristics of adjusted and matched cohorts of psoriatic patients without arthritis initiating second-line treatment with iIL12/23, iIL17, or iIL23 compared to those receiving first-line iTNF.
| IL12/23i(2580) | TNFi(2580) | p-Value | IL17i(1700) | TNFi(1700) | p-Value | IL23i(1010) | TNFi(1010) | p-Value | IL23i(1010) | IL17i(1010) | p-Value | |
|---|---|---|---|---|---|---|---|---|---|---|---|---|
| Primary outcome events/person-years | 160 | 210 | – | 180 | 160 | – | 60 | 100 | – | 60 | 110 | – |
| Cumulative incidence of arthritis, per 100 person-years | 6.2 | 8.1 | – | 10.6 | 9.4 | – | 5.9 | 9.9 | – | 5.0 | 10.9 | – |
| Current Age, years | 44.8±18.8 | 45.8±18.7 | 0.058 | 50.7±16.5 | 53.5±16.7 | <0.001 | 50.3±15.1 | 54.4±16.0 | <0.001 | 50.3±15.1 | 51.0±16.3 | 0.330 |
| Age at index, years | 39.7±18.0 | 39.6±17.9 | 0.857 | 47.0±16.1 | 47.4±16.1 | 0.467 | 47.8±15.1 | 48.1±15.4 | 0.599 | 47.8±15.1 | 47.2±16.0 | 0.382 |
| Sex | ||||||||||||
| Male | 1110 (43.0%) | 1100 (42.6%) | 0.778 | 770 (45.3%) | 780 (45.9%) | 0.731 | 520 (51.5%) | 520 (51.5%) | 1 | 520 (51.5%) | 510 (50.5%) | 0.656 |
| Female | 1450 (56.2%) | 1470 (57.0%) | 0.574 | 920 (54.1%) | 920 (54.1%) | 1 | 490 (48.5%) | 490 (48.5%) | 1 | 490 (48.5%) | 500 (49.5%) | 0.656 |
| Race/ethnicity | ||||||||||||
| White | 1930 (74.8%) | 1880 (72.9%) | 0.113 | 1190 (70.0%) | 1260 (74.1%) | 0.007 | 740 (73.3%) | 740 (73.3%) | 1 | 740 (73.3%) | 720 (71.3%) | 0.320 |
| Black or African American | 210 (8.1%) | 220 (8.5%) | 0.614 | 140 (8.2%) | 140 (8.2%) | 1 | 70 (6.9%) | 80 (7.9%) | 0.396 | 70 (6.9%) | 80 (7.9%) | 0.396 |
| Asian | 60 (2.3%) | 80 (3.1%) | 0.087 | 70 (4.1%) | 50 (2.9%) | 0.063 | 60 (5.9%) | 40 (4.0%) | 0.281 | 60 (5.9%) | 50 (5.0%) | 0.327 |
| Other or not available | 280 (10.9%) | 330 (12.8%) | 0.031 | 220 (12.9%) | 200 (11.8%) | 0.297 | 110 (10.9%) | 140 (13.9%) | 0.043 | 110 (10.9%) | 140 (13.9%) | 0.043 |
| Comorbidities before the index date | ||||||||||||
| Overweight, obesity and other hyperalimentation | 530 (20.5%) | 530 (20.5%) | 1 | 480 (28.2%) | 500 (29.4%) | 0.449 | 280 (27.7%) | 300 (29.7%) | 0.325 | 280 (27.7%) | 270 (26.7%) | 0.617 |
| Obesity (body-max index >30kg/m2) | 1270 (49.2%) | 1220 (47.3%) | 0.040 | 490 (28.8%) | 520 (30.6%) | 0.260 | 220 (21.8%) | 220 (21.8%) | 1 | 220 (21.8%) | 210 (20.8%) | 0.587 |
| Tobacco use or tobacco use disorder | 370 (14.3%) | 340 (13.2%) | 0.225 | 310 (18.2%) | 310 (18.2%) | 1 | 160 (15.8%) | 160 (15.8%) | 1 | 160 (15.8%) | 150 (14.9%) | 0.027 |
| Alcohol related disorders | 80 (3.1%) | 60 (2.3%) | 0.087 | 110 (6.5%) | 110 (6.5%) | 1 | 60 (5.9%) | 60 (5.9%) | 1 | 60 (5.9%) | 60 (5.9%) | 1 |
| Onycholysis | 40 (1.6%) | 30 (1.2%) | 0.229 | 30 (1.8%) | 10 (0.6%) | 0.001 | 20 (2.0%) | 20 (2.0%) | 1 | 20 (2.0%) | 10 (1.0%) | 0.066 |
| Chronic obstructive pulmonary disease | 80 (3.1%) | 90 (3.5%) | 0.435 | 90 (5.3%) | 90 (5.3%) | 1 | 40 (4.0%) | 40 (4.0%) | 1 | 40 (4.0%) | 50 (5.0%) | 0.281 |
| Congestive heart failure | 70 (2.7%) | 60 (2.3%) | 0.374 | 50 (2.9%) | 60 (3.5%) | 0.332 | 30 (3.0%) | 40 (4.0%) | 0.224 | 30 (3.0%) | 30 (3.0%) | 1 |
| Diabetes mellitus | 260 (10.1%) | 310 (12.0%) | 0.026 | 300 (17.6%) | 300 (17.6%) | 1 | 160 (15.8%) | 180 (17.8%) | 0.234 | 160 (15.8%) | 160 (15.8%) | 1 |
| Liver disease | 230 (8.9%) | 170 (6.6%) | 0.002 | 160 (9.4%) | 160 (9.4%) | 1 | 100 (9.9%) | 100 (9.9%) | 1 | 100 (9.9%) | 90 (8.9%) | 0.446 |
| Renal disease | 120 (4.7%) | 90 (3.5%) | 0.035 | 80 (4.7%) | 80 (4.7%) | 1 | 50 (5.0%) | 50 (5.0%) | 1 | 50 (5.0%) | 40 (4.0%) | 0.281 |
| DMARDs before the index date | ||||||||||||
| Methotrexate | 780 (30.2%) | 790 (30.6%) | 0.762 | 440 (25.9%) | 440 (25.9%) | 1 | 220 (21.8%) | 200 (19.8%) | 0.273 | 220 (21.8%) | 220 (21.8%) | 1 |
| Cyclosporine | 150 (5.8%) | 140 (5.4%) | 0.546 | 100 (7.1%) | 100 (5.9%) | 0.163 | 50 (5.0%) | 40 (4.0%) | 0.281 | 50 (5.0%) | 50 (5.0%) | 1 |
| Acitretin | 150 (5.8%) | 140 (5.4%) | 0.546 | 90 (5.3%) | 90 (5.3%) | 1 | 60 (5.9%) | 50 (5.0%) | 0.327 | 60 (5.9%) | 60 (5.9%) | 1 |
| Apremilast | 0 (0%) | 0 (0%) | – | 0 (0%) | 0 (0%) | – | 0 (0%) | 0 (0%) | – | 0 (0%) | 0 (0%) | – |
| Upadacitinib | 0 (0%) | 0 (0%) | – | 0 (0%) | 0 (0%) | – | 0 (0%) | 0 (0%) | – | 0 (0%) | 0 (0%) | – |
| Tofacitinib | 0 (0%) | 0 (0%) | – | 0 (0%) | 0 (0%) | – | 0 (0%) | 0 (0%) | – | 0 (0%) | 0 (0%) | – |
| Deucravacitinib | 0 (0%) | 0 (0%) | – | 0 (0%) | 0 (0%) | – | 0 (0%) | 0 (0%) | – | 0 (0%) | 0 (0%) | – |
| DMARDb after the index date | ||||||||||||
| TNF inhibitor | ||||||||||||
| Adalimumab | 1700 (65.9%) | 1620 (62.8%) | 0.020 | 1370 (80.6%) | 1140 (67.1%) | <0.001 | 840 (83.2%) | 660 (65.3%) | <0.001 | 840 (83.2%) | 830 (82.2%) | 0.557 |
| Etanercept | 710 (27.5%) | 630 (24.4%) | 0.011 | 430 (25.3%) | 390 (22.9%) | 0.109 | 210 (20.8%) | 240 (23.8%) | 0.109 | 210 (20.8%) | 250 (24.8%) | 0.034 |
| Infliximab | 660 (25.6%) | 430 (16.7%) | <0.001 | 100 (5.9%) | 250 (4.7%) | <0.001 | 40 (4.0%) | 130 (12.9%) | <0.001 | 40 (4.0%) | 60 (5.9%) | 0.040 |
| Certolizumab | 170 (6.6%) | 70 (2.7%) | <0.001 | 50 (2.9%) | 40 (2.4%) | 0.285 | 40 (4.0%) | 20 (2.0%) | 0.009 | 40 (4.0%) | 30 (3.0%) | 0.224 |
| Golimumab | 30 (1.2%) | 40 (1.6%) | 0.229 | 40 (2.4%) | 20 (1.2%) | 0.009 | 10 (1.0%) | 20 (2.0%) | 0.066 | 10 (1.0%) | 30 (3.0%) | 0.001 |
| IL12/23 inhibitor | ||||||||||||
| Ustekinumab | 2580 (100%) | 0 (0%) | <0.001 | 0 (0%) | 0 (0%) | - | 0 (0%) | 0 (0%) | – | 0 (0%) | 0 (0%) | – |
| IL17 inhibitor | ||||||||||||
| Secukinumab | 0 (0%) | 0 (0%) | – | 1060 (62.4%) | 0 (0%) | <0.001 | 0 (0%) | 0 (0%) | – | 0 (0%) | 630 (62.4%) | <0.001 |
| Ixekizumab | 0 (0%) | 0 (0%) | – | 650 (38.2%) | 0 (0%) | <0.001 | 0 (0%) | 0 (0%) | – | 0 (0%) | 390 (38.6%) | <0.001 |
| Brodalumab | 0 (0%) | 0 (0%) | – | 20 (1.2%) | 0 (0%) | <0.001 | 0 (0%) | 0 (0%) | – | 0 (0%) | 10 (1.0%) | <0.001 |
| IL23 inhibitor | ||||||||||||
| Guselkumab | 0 (0%) | 0 (0%) | – | 0 (0%) | 0 (0%) | – | 340 (33.7%) | 0 (0%) | <0.001 | 340 (33.7%) | 0 (0%) | <0.001 |
| Tildrakizumab | 0 (0%) | 0 (0%) | – | 0 (0%) | 0 (0%) | – | 40 (4.0%) | 0 (0%) | <0.001 | 40 (4.0%) | 0 (0%) | <0.001 |
| Risankizumab | 0 (0%) | 0 (0%) | – | 0 (0%) | 0 (0%) | – | 650 (64.4%) | 0 (0%) | <0.001 | 640 (63.4%) | 0 (0%) | <0.001 |

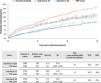
Furthermore, the incidence rate of PsA was compared between the IL17i and IL23i cohorts in both first- and second-line therapies. It was observed that the risk of developing PsA was significantly lower with IL23i than with IL17i in both therapy lines (Figs. 1c and 4).

All reviewed records had a correct diagnosis and treatment. The only error detected is in the treatment line: 13-15% records were actually posterior lines.
DiscussionOur investigation revealed a reduced risk of PsA development associated with IL12/23i and IL23i vs TNFi. Conversely, IL17i did not exhibit a significant difference in PsA risk compared to TNFi.
Although these findings are consistent with those reported by Singla et al.,12 in a U.S. cohort, our study cohort is substantially larger. While they primarily investigated inflammatory arthritis in adult psoriatic patients initiating biologic therapy, including PsA in some sensitivity analyses, our study focused on patients diagnosed with PsO without arthritis initiating biologic therapy for the first time. We compared the risk of developing PsA across different classes of biologics, after adjusting for risk factors such as sex, time since PsO onset, obesity (BMI >30), alcohol/tobacco abuse, nail psoriasis, and cDMARDs.
Another single-center study with 1023 patients found no significant differences in PsA prevalence among different biologic classes. However, PsA was numerically lower in patients on IL17i (1.9%) and IL23i or IL12/23i (6.1%) vs TNFi (8.8%).13
Moreover, our investigation extended also to PsO patients without arthritis who initiated IL12/23i, IL17i, or IL23i as second-line therapy, contrasting them with individuals with TNFi as first-line. This methodological approach aligns more closely with real-world clinical practices, in regions such as Spain, where the public health system recommends initiating therapy with TNFi biosimilars for the management of moderate-to-severe PsO cases requiring biologic therapy. Even in the second-line scenario, we observed a diminished risk of developing PsA with IL12/23i and IL23i vs TNFi 3 years after starting first-line therapy.
These findings are consistent with the established understanding of IL23 in the pathogenesis of enthesitis, which marks the onset of PsA15; perhaps once activated, other pathways of immunity explain why IL17i or TNFi are more effective than IL12/23i and IL23i in established PsA with a high inflammatory burden, especially in axial forms.
This study has several limitations, primarily related to its observational and retrospective design, which limits the ability to establish causal relationships and necessitates cautious interpretation of the findings, as they are primarily hypothesis-generating. Potential inaccuracies in diagnostic coding and biases in the selection of biologic therapies may also be present within the dataset. In particular, protopathic bias – whereby treatment is initiated in patients with early or subclinical PsA before a formal diagnosis – is possible and may have led to an overestimation of the observed associations. Despite these limitations, the study has notable strengths. It represents one of the largest and longest investigations of patients with psoriasis treated with biologic agents, thereby providing valuable insights and contributing substantially to the existing body of evidence in this field.
Prospective studies are needed to determine whether treatment strategies for patients with psoriasis aimed at preventing PsA onset should differ from those used once PsA is established. In other words, should prevention and interception of PsA be managed in the same way?
Conflicts of interestRaquel Rivera acted as a consultant and/or speaker for and/or participated in clinical trials sponsored by companies that manufacture drugs used for the treatment of psoriasis, including Abbvie, Almirall, Amgen, Boehringer Ingelheim, Bristol Myers Squibb, Incyte, Johnson & Johnson, Leo Pharma, Lilly, Novartis, Pfizer and UCB.
Carmen García-Donoso acted as a consultant and/or speaker for and/or participated in clinical trials sponsored by companies that manufacture drugs used for the treatment of psoriasis, including Abbvie, Almirall, Amgen, Bristol Myers Squibb, Johnson & Johnson, Leo Pharma, Lilly, Novartis and UCB.
Beatriz Joven collaborated as a consultant, speaker for Amgen, UCB, Abbvie, Johnson & Johnson, Novartis, Lilly and has participated as a researcher in Abbvie, Johnson & Johnson, Novartis, Lilly, Bristol Myers Squibb trials/studies.
Jose Luis Pablos collaborated as a consultant, speaker for Amgen, UCB, Abbvie, Johnson & Johnson, Novartis, Lilly and has participated as a researcher in Abbvie, Johnson & Johnson, Novartis, Lilly, Bristol Myers Squibb trials/studies.
Gema Hernandez-Ibarburu and Pablo L. Ortiz-Romero declared no conflicts of interest regarding this manuscript.