
The new WHO classification distinguishes two main pathogenic pathways for cutaneous melanoma, low and high-chronic sun damage (CSD). However, there are no studies to support its validity in the category of non-acral cutaneous lentiginous melanoma (NACLM). Thus, the aim of this study was to correlate the degree of solar elastosis (SE) with a range of clinicopathologic and genomic parameters in a cohort of NACLMs.
Material and methodsWe conducted a retrospective cohort study of patients affected by an in situ or invasive NACLM distributed across three groups depending on the grade of SE. NACLM includes lentigo maligna melanoma and lentigo maligna, and other non-acral cutaneous lesions with a lentiginous growth pattern.
ResultsThe study included a total of 257 patients, 132 men (51.4%) and 125 women (48.6%) with a median age of 71 years. SE grade I was reported in 38 cases (14.8%), grade II in 61 cases (23.7%), and grade III in 158 cases (61.5%). Higher SE grade was related to head/neck location, older age at diagnosis and presence of lentigines in melanoma area. Lower SE grade was related to other locations, higher nevi count, presence of regression and BRAF V600E mutation (univariate logistic regression quantification: V600E vs WT; OR, 0.23; 95%CI, 0.05–1.06; p=0.059).
ConclusionSE grade is useful to classify NACLMs in different groups distinguished by their clinical, pathological, and molecular features. These results endorse the new WHO classification of low- and high-CSD melanomas. Moreover, they highlight the importance of reporting the grade of SE in the pathological report.

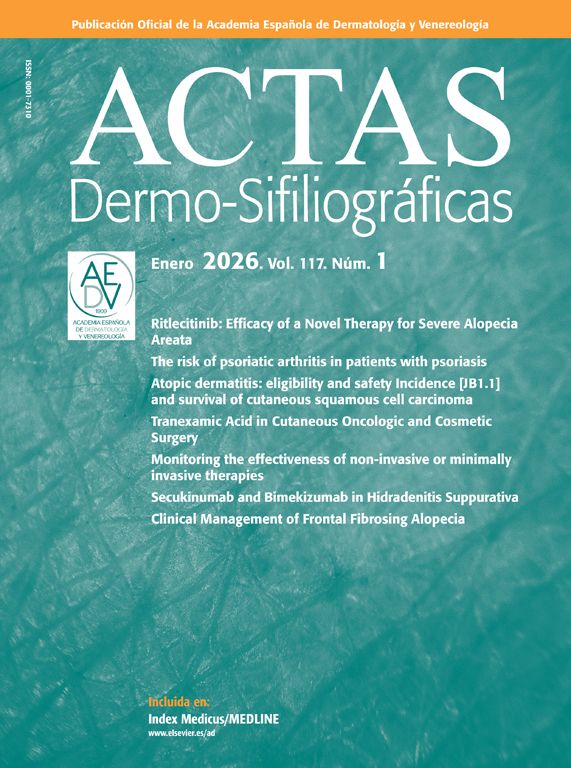
The 4th edition of the World Health Organization (WHO) Classification of Skin Tumors, published in 2018, reclassified superficial spreading melanomas (SSMs) as low-CSD melanomas and lentigo maligna melanomas (LMMs) as high-CSD melanomas.1,2 High-CSD is defined by the histological observation of severe (grade III) solar elastosis (SE) in the dermis of the surrounding healthy skin around the cutaneous melanoma (CM).1–3 Grade III SE is described by the presence of homogeneous clumps of elastotic material that have lost their texture of individual fibrils2 (Fig. 1A). In turn, low-CSD is the absence of SE, or the presence of mild (grade I [Fig. 1B]) or moderate (grade II) SE. Thus, the grade of SE became a major criterion to distinguish between these two types of CM.

Non-acral cutaneous lentiginous melanomas (NACLMs) are mostly represented by LMM and its precursor lentigo maligna (LM). According to the new WHO classification, these CMs that present a lentiginous growth pattern must demonstrate a grade III SE to be defined as high-CSD melanomas/LMMs.2 However, low-CSD melanomas/SSMs can occasionally occur in high-CSD skin. Moreover, moderate-to-severe SE can be sometimes considered sufficient to define high-CSD.2 Finally, SE is not always reported in pathological reports.
On the other hand, although the classical histological definition of LMM includes the presence of SE in the dermis, it does not provide a threshold.4 Indeed, there are NACLMs with grade I SE or without SE. These lesions are usually categorized as lentiginous melanomas.5 According to the WHO classification, these lesions should be categorized as lentiginous low-CSD melanomas/SSMs.6
The new WHO classification is supported by molecular findings that distinguish the various melanoma pathways. The most common driver mutation of low-CSD melanomas/SSMs is BRAF V600E, while the driver mutations of high-CSD melanomas/LMMs include NF1, BRAF V600K (or other non-V600E mutations), NRAS and c-KIT.1–3,6–8 Nevertheless, these molecular differences have not been analyzed in the category of NACLMs.
Based on these findings, we conducted a retrospective study of patients with histologically confirmed nonacral cutaneous lentiginous melanoma, stratified by the grade of solar elastosis reported in the pathology report, to identify clinical, pathological, and molecular differences among groups that may support the new World Health Organization classification.
Materials and methodsStudy designThe present study is a retrospective cohort study on patients affected by in situ or invasive NACLMs. Cases were collected from January 1st, 2000 through June 25th, 2021.
We aimed to correlate the degree of solar elastosis (SE) with a range of clinicopathologic and genomic parameters available in our database (including mutational status of BRAF, NRAS, c-KIT, and pTERT), as a test of the validity and applicability of the WHO classification in our setting. Therefore, we established a category of NACLM in the computerized melanoma patient database of the Department of Dermatology of Instituto Valenciano de Oncología (Valencia, España). NACLMs generally correspond to the traditional categories of LM, LMM, and related entities. Other categories include nonacral cutaneous lesions with a lentiginous growth pattern that do not conform to the LM or LMM classifications, such as lentiginous melanomas.5
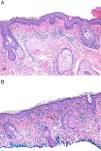
Therefore, acral lentiginous melanomas and mucosal lentiginous melanomas were excluded. All patients have their prior written informed consent for inclusion in the database and participation in the study. Cases lacking information on the grade of solar elastosis in the pathology report were also excluded (Fig. 1).
Grade of SE defined the three main study groups: (I) absent or mild SE (0, 0+, 1−, 1 and 1+); (II) moderate SE (2−, 2 and 2+); and (III) severe SE (3−, 3 and 3+). This grouping used the 11 grades of SE (from 0 to 3+) depicted in the WHO manual and in a previous work by the same authors.1,7
During the statistical analysis, two more groups were defined by CSD status: (1) low-CSD (from 0 to 2−) and (2) high-CSD (from 2 to 3+). Previously, these two groups have been defined as non-CSD and CSD.7Table 1 illustrates the criteria used to define SE grade.
Criteria used to define the three grades of solar elastosis.
| Grade I | Absence of elastotic fibers, or the presence of rare elastotic fibers visible only at 200× magnification, or scattered elastotic fibers appearing as individual units. |
| Grade II | Densely scattered elastotic fibers primarily arranged in clusters rather than as individual units. |
| Grade III | Amorphous deposits of blue–gray material with lost fibrillary texture. |
Variables selected were gender, age at diagnosis (<71 vs ≥71 years), history of sunburns at melanoma area, history of chronic solar exposure, presence of lentigines in melanoma area, history of actinic keratosis, history of basal/squamous cell carcinoma, nevi count (<20 vs ≥20 nevi), history of multiple melanoma, history of familial melanoma, location (1=head/neck vs 2=upper extremity vs 3=trunk vs 4=lower extremity), ulceration status, mitotic rate (0 vs ≥1mitosis/mm2), histological regression status, Breslow thickness (in situ vs <2mm vs ≥2mm), BRAF status [WT (wild type) vs V600E vs non-V600E], NRAS status (WT vs mutated), c-KIT status (WT vs mutated), pTERT status (WT vs mutated), number of variants of MC1R (0 vs ≥1) and R variants (RHC) (0 vs ≥1). Somatic genetic analysis is described in the supplementary data.
Statistical analysisContinuous variables were expressed as mean and standard deviation when they followed a normal distribution at Kolmogorov–Smirnov test; otherwise, they were expressed as median and interquartile range (IQR). Qualitative variables were expressed as number and percentage.
Contingency tables were used to assess differences in the distribution of each variable across the 3 study groups and the significance was analyzed by Pearson's chi-square and Fisher's exact tests.
Regression imputation was performed to complete the dataset. Variables relative to BRAF, NRAS, c-KIT and pTERT status, and no. of variants of MC1R were not imputed to avoid creating false imputations. Consequently, the missing values of these variables were labeled as unknown.
A principal component analysis (PCA) was performed as exploratory analysis. Individuals were plotted in these components depending on their grade of SE, that was introduced as an external variable. The results of PCA were validated by residual sum of squares and T2 of Hotelling methods.
The PCA was followed by a partial least squares (PLS) regression. In this case, grade of SE was introduced as the response variable, while the other variables were transformed to predict them in the model; continuous variables were centered and scaled, and the qualitative ones were converted in dummies. The PLS model was validated both for individuals (residual sum of squares and T2 of Hotelling methods) and variables [analyzing the variable importance of projection (VIP) and coefficient of regression]. For each variable included in the final PLS model, a univariate ordinal logistic regression was performed to quantify its association with the response variable.
The same analysis was then conducted for the CSD. In this case, a PLS discriminant analysis (PLS-DA) was used to create the models instead of a PLS regression, since CSD cannot be treated as an ordinal variable.
Finally, data of the mutational status were not available in all patients. Thus, PLS and PLS-DA were repeated including only the patients that had data of BRAF and NRAS status.
Statistical analysis was performed using IBM SPSS version 20.0 and RStudio version 4.1.0. All p values were two-tailed, and statistical significance was set at α=0.05.
ResultsA total of 359 patients with histological diagnosis of NACLM were recovered from the IVO Dermatology Department melanoma database. A total of 102 patients were excluded because SE grade was not available. Therefore, the final dataset included 257 patients (132 men [51.4%] and 125 women [48.6%]) with a median age of 71 years (IQR, 61–77).
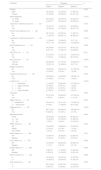
SE grade I was observed in 38 cases (14.8%), grade II in 61 (23.7%), and grade III in 158 (61.5%) (Fig. 2). Contingency tables showed that SE grade III was statistically associated with age at diagnosis ≥71 years (p<0.0001), presence of lentigines in melanoma area (p<0.0001), nevi count <20 (p<0.0001), head/neck location (p<0.0001), and absence of histological regression (p<0.0001) (Table 2).

Population description, and contingency tables between elastosis grades and variables.
| Variables | Elastosis | p | ||
|---|---|---|---|---|
| Grade I | Grade II | Grade III | ||
| Gender | 0.278 | |||
| Male | 24 (63.2%) | 31 (50.8%) | 77 (48.7%) | |
| Female | 14 (36.8%) | 30 (49.2%) | 81 (51.3%) | |
| Age at diagnosis | <0.001 | |||
| <71 years | 29 (76.3%) | 29 (47.5%) | 64 (40.5%) | |
| ≥71 years | 9 (23.7%) | 32 (52.5%) | 94 (59.5%) | |
| Sunburns in melanoma area (m.v.=35) | 0.133 | |||
| No | 15 (44.1%) | 13 (24.1%) | 40 (29.9%) | |
| Yes | 19 (55.9%) | 41 (75.9%) | 94 (70.1%) | |
| Chronic solar exposure (m.v.=26) | 0.088 | |||
| No | 26 (70.3%) | 32 (59.3%) | 71 (50.7%) | |
| Yes | 11 (29.7%) | 22 (40.7%) | 69 (49.3%) | |
| Lentigines in melanoma area (m.v.=23) | <0.001 | |||
| No | 11 (28.9%) | 13 (23.6%) | 10 (7.1%) | |
| Yes | 27 (71.1%) | 42 (76.4%) | 131 (92.9%) | |
| Actinic keratosis (m.v.=23) | 0.056 | |||
| No | 30 (78.9%) | 42 (73.7%) | 85 (61.2%) | |
| Yes | 8 (21.1%) | 15 (26.3%) | 54 (38.8%) | |
| BCC/SCC (m.v.=10) | 0.211 | |||
| No | 31 (81.6%) | 41 (70.7%) | 123 (81.5%) | |
| Yes | 7 (18.4%) | 17 (29.3%) | 28 (18.5%) | |
| Nevi count (m.v.=37) | <0.001 | |||
| <20 nevi | 24 (64.9%) | 41 (77.4%) | 120 (92.3%) | |
| ≥20 nevi | 13 (35.1%) | 12 (22.6%) | 10 (7.7%) | |
| Multiple melanoma | 0.072 | |||
| No | 33 (86.8%) | 59 (96.7%) | 151 (95.6%) | |
| Yes | 5 (13.2%) | 2 (3.3%) | 7 (4.4%) | |
| Familial melanoma (m.v.=20) | 0.069 | |||
| No | 32 (84.2%) | 52 (92.9%) | 136 (95.1%) | |
| Yes | 6 (15.8%) | 4 (7.1%) | 7 (4.9%) | |
| Location (m.v.=1) | <0.001 | |||
| 1=head/neck | 11 (28.9%) | 36 (60.0%) | 157 (99.4%) | |
| 2=upper extremity | 6 (15.8%) | 9 (15.0%) | 1 (0.6%) | |
| 3=trunk | 15 (39.5%) | 9 (15.0%) | 0 (0.0% | |
| 4=lower extremity | 6 (15.8%) | 6 (10.0%) | 0 (0.0%) | |
| Ulceration | 0.393 | |||
| No | 37 (97.4%) | 55 (90.2%) | 147 (93.0%) | |
| Yes | 1 (2.6%) | 6 (9.8%) | 11 (7.0%) | |
| Mitotic rate (m.v.=15) | 0.033 | |||
| 0mitosis/mm2 | 35 (92.1%) | 42 (71.2%) | 119 (82.1%) | |
| ≥1mitosis/mm2 | 3 (7.9%) | 17 (28.8%) | 26 (17.9%) | |
| Regression (m.v.=33) | <0.001 | |||
| No | 28 (77.8%) | 49 (86.0%) | 129 (98.5%) | |
| Yes | 8 (22.2%) | 8 (14.0%) | 2 (1.5%) | |
| Breslow thickness | 0.046 | |||
| In situ | 24 (63.2%) | 30 (49.2%) | 98 (62.0%) | |
| <2mm | 13 (34.2%) | 27 (44.3%) | 41 (25.9%) | |
| ≥2mm | 1 (2.6%) | 4 (6.6%) | 19 (12.0%) | |
| BRAF status (m.v.=147) | 0.426 | |||
| WT | 12 (80.0%) | 33 (86.8%) | 53 (93.0%) | |
| V600E | 2 (13.3%) | 3 (7.9%) | 1 (1.8%) | |
| Non-V600E | 1 (6.7%) | 2 (5.3%) | 3 (5.3%) | |
| NRAS status (m.v.=146) | 0.731 | |||
| WT | 13 (86.7%) | 32 (84.2%) | 52 (89.7%) | |
| Mutated | 2 (13.3%) | 6 (15.8%) | 6 (10.3%) | |
| c-KIT status (m.v.=172) | 0.992 | |||
| WT | 12 (92.3%) | 28 (93.3%) | 39 (92.9%) | |
| Mutated | 1 (7.7%) | 2 (6.7%) | 3 (7.1%) | |
| pTERT status (m.v.=190) | 0.468 | |||
| WT | 8 (66.7%) | 11 (45.8%) | 15 (48.4%) | |
| Mutated | 4 (33.3%) | 13 (54.2%) | 16 (51.6%) | |
| MC1R variants (m.v.=82) | 0.948 | |||
| 0 | 10 (34.5%) | 18 (37.5%) | 37 (37.8%) | |
| ≥1 | 19 (65.5%) | 30 (62.5%) | 61 (62.2%) | |
| RHC variants (m.v.=83) | 0.433 | |||
| 0 | 23 (79.3%) | 39 (81.2%) | 70 (72.2%) | |
| ≥1 | 6 (20.7%) | 9 (18.8%) | 27 (27.8%) | |
m.v., missing values; BCC, basal cell carcinoma; SCC, squamous cell carcinoma; WT, wild type; RHC, R variants.
Before completing the dataset with regression imputation, a total of 8 cases were excluded because more than 30% of their data were missing. Thus, the dataset was restricted to 249 patients.
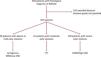
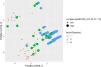
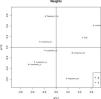
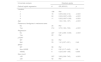
The PCA score plot for prediction of SE grade extracted seven principal components, which explained 52.4% of the variability. No clear spontaneous distribution of individuals was observed. The PLS final model explained 24.5% of the variability and 54.4% of the variability of SE grade. In the PLS score plot a clear difference between SE grade I and III was reported, while there was some confusion with the SE grade II, which aligns with either grade I or III. PLS weights showed that higher SE grade was related to head/neck location and, less so, to older age at diagnosis and presence of lentigines in melanoma area. On the other hand, lower SE grade was related to other locations and higher nevi count. Additionally, the presence of histological regression seemed to be related to a lower SE grade, but with a weak association (Fig. 3). Although pTERT and BRAF status were included in the PLS final model, their low VIPs and not significant p-values impaired evaluating their relation with SE grade. PLS results were quantified by univariate ordinal logistic regressions (Table 3). The classification error rate of this model was 36.7%.

Univariate ordinal logistic regressions quantifying partial least squares regression results with solar elastosis grade as the response variable. Location 1, head/neck; 2, upper extremity; 3, trunk; 4, lower extremity.
| Univariate analysis | Elastosis grade | ||
|---|---|---|---|
| Ordinal logistic regression | # | OR (95%CI) | p |
| Location | |||
| 1 | 198 | Ref | |
| 2 | 16 | 0.05 (0.02–0.14) | <0.001 |
| 3 | 24 | 0.02 (0.007–0.05) | <0.001 |
| 4 | 11 | 0.03 (0.007–0.09) | <0.001 |
| Age | 1.04 (1.02–1.07) | <0.001 | |
| Presence of lentigines in melanoma area | |||
| No | 35 | Ref | |
| Yes | 214 | 3.73 (1.92–7.32) | <0.001 |
| Regression | |||
| No | 227 | 5.81 (2.66–13.06) | <0.001 |
| Yes | 22 | Ref | |
| pTERT | |||
| WT | 34 | Ref | |
| Mut | 33 | 1.41 (0.57–3.51) | 0.46 |
| BRAF | |||
| WT | 98 | Ref | |
| Non-V600E | 6 | 0.81 (0.17–4.43) | 0.8 |
| V600E | 6 | 0.23 (0.05–1.06) | 0.059 |
| Nevi count | |||
| <20 | 207 | 3.92 (2.09–7.43) | <0.001 |
| ≥20 | 42 | Ref | |
OR, odd ratio; Ref, reference; WT, wild type.
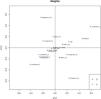
The confusion matrix (the table layout that permits observation of the algorithm performance) showed that the main problem of this model was classifying patients with SE grade II: 9 of them were classified as SE grade I, and 24 as SE grade III. Although the CSD status was introduced in the PLS to explain the confusion, the score plot did not show a clear difference across the groups (Fig. 4). Instead, the analysis showed that among the 9 patients with SE grade II misclassified as grade I, 6 had low CSD and 3 had high CSD. In contrast, among the 24 patients predicted as grade III, only 4 had low CSD.

PLS-DA was realized using CSD status as the response variable. The final model explained 17.4% of the variability and 55.9% of CSD status variability. Although the error rate of this model was lower than the previous one (14.35%), it could not discriminate between low-CSD and high-CSD (Fig. 5).

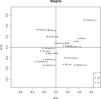
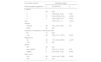
Including only patients with available BRAF and NRAS mutation status restricted the dataset to 110 patients. PLS with SE grade as response variable produced a final model that explained 27.3% of the variability and 47.1% of SE grade variability. The PLS score and weights showed similar results to those obtained with the full dataset. In addition to those results, a weak association was observed between lower SE grade and BRAF V600E mutation, as well as between la ower SE grade and the presence of regression. Even if gender and a past medical history of chronic solar exposure did not show relevant VIPs or significant p-values for the regression coefficients, they were left in the model to avoid increasing its error rate (Fig. 6). Univariate ordinal logistic regression quantified BRAF V600E (V600E vs WT: OR, 0.23; 95%CI, 0.05–1.06; p=0.059) and other variable association with SE grade (Table 4). The classification error rate of this model was 20.59%.

Univariate ordinal logistic regressions quantifying partial least squares regression results with solar elastosis grade as the response variable in the restricted dataset of 110 patients with data of BRAF and NRAS status. Location 1, head/neck; 2, upper extremity; 3, trunk; 4, lower extremity.
| Univariate analysis | Elastosis grade | ||
|---|---|---|---|
| Ordinal logistic regression | # | OR (95%CI) | p |
| Location | |||
| 1 | 89 | Ref | |
| 2 | 7 | 0.08 (0.02–0.35) | 0.001 |
| 3 | 10 | 0.04 (0.009–0.16) | <0.001 |
| 4 | 4 | 0.04 (0.005–0.3) | 0.002 |
| Age | 1.06 (1.03–1.1) | <0.001 | |
| Gender | |||
| Female | 46 | 1.81 (0.87–3.84) | 0.11 |
| Male | 64 | Ref | |
| Presence of lentigines in melanoma area | |||
| No | 15 | Ref | |
| Yes | 95 | 3.85 (1.41–10.87) | 0.009 |
| Regression | |||
| No | 94 | 7.01 (2.52–20.66) | <0.001 |
| Yes | 16 | Ref | |
| BRAF | |||
| WT | 98 | Ref | |
| Non-V600E | 6 | 0.81 (0.17–4.43) | 0.79 |
| V600E | 6 | 0.23 (0.05–1.06) | 0.059 |
| Nevi count | |||
| <20 | 89 | 4.06 (1.64–10.36) | 0.003 |
| ≥20 | 21 | Ref | |
OR, odd ratio; Ref, reference; WT, wild type.
This observational retrospective study collected data on 257 NACLM patients. Most of them (61.5%) had grade III SE in the dermis surrounding the tumor (Fig. 2). This finding was statistically associated with head/neck location, older age, presence of lentigines in melanoma area, having less than 20 nevi, and absence of histological regression (Table 2). Analyzing the full dataset of patients, mutational status of BRAF, NRAS, c-KIT, and pTERT were not statistically associated with the grade of SE (Fig. 3). However, after restricting the dataset to the 110 patients with data on BRAF and NRAS status, a weak association between BRAF V600E mutation and a lower grade of SE was observed in the PLS weights (Fig. 6). Their relation was quantified as an OR of 0.23 with an almost significant p-value (0.059) (Table 4). This result showed that the grade of SE may serve to distinguish different pathogenetic pathways between CMs with a lentiginous growth pattern, as pointed out by the new WHO classification for CMs in general.1
The main limitation of these results is the low prevalence of mutations of BRAF and the other genes in the study population. Indeed, only 12 out of 110 patients had a mutation of BRAF, half of them in V600E and the other half in non-V600E position. Nevertheless, observing the numerical distribution of BRAF mutations, it is remarkable that BRAF WT was more common in tumors with SE grade III vs SE grade II and I (93% vs 86.8% vs 80%, respectively), whereas V600E mutation was symmetrically distributed (1.8% vs 7.9% vs 13.3%, respectively) (Table 2). Thus, NACLMs with absent or mild SE harbor the BRAF V600E mutation more frequently than those with moderate or severe SE. This is consistent with former published literature of CM and the new WHO classification.1,3,6,8,9 The main problem of the full dataset PLS model was classifying patients with SE grade II. In fact, the PLS confusion matrix showed that 33 patients with SE grade II were wrongly classified: 9 as SE grade I and 24 as SE grade III. The PLS score plot incorporating CSD status showed that among the 9 cases predicted as SE grade I, 6 (66.6%) were low CSD, whereas only 4 (16.6%) of the 24 cases predicted as SE grade III were correctly classified (Fig. 4). Consequently, although the CSD status could have better classified NACLM patients, the statistical analysis using it as the response variable did not result in significant PLS-DA final models (Fig. 5), which may be due to the cut-off point used to discriminate between low- and high-CSD that was set at SE grade 2 (the 7th grade out of 11), as previously described.1,7 On the other hand, it may suggest that low- and high-CSD are opposite poles of the same disease spectrum that varies by the grade of SE in the dermis around the CM; thus, it may be difficult to set a clear cut-off point.
Although mutations of pTERT are usually associated with high-CSD, they are also present in low-CSD melanomas.10–12 Indeed, they are evenly distributed across SE grades of CMs,9 which is why we did not observe a statistically significant association between pTERT mutations and the grade of SE in NACLMs. However, as per BRAF, also pTERT mutations were more prevalent in grade II and III vs grade I SE (Table 2).
Mutations in c-KIT were rare and not related to SE grade, as previously observed for CMs,9 which was also observed when using the low- and high-CSD classification.13
Clinical and pathological variables further supported these results. Head and neck location, female gender, older age, and presence of lentigines in the area where the NACLM appeared were associated with a higher SE grade, whereas having 20 or more nevi or showing regression in the histological slides was associated with a lower SE grade. These findings are consistent with previously published literature on CM and SE.9,14 Remarkably, they showed a spectrum-like distribution of CM clinical characteristics across SE grades (as opposed to a clustered distribution). For example, mild SE was more frequent in younger patient or in patients with a higher total nevus count, and progressively became less frequent with increasing age or lower total nevus count.14 In our study, although the clinical results were further endorsed by observing a correlated distribution of BRAF V600E mutation across the different SE grades, it was not statistically significant. This association was demonstrated in a former study where the absence of elastosis was associated with younger age, benign nevus remnants, and positive BRAF V600E expression (p<0.0001), which is similar to our findings.9
Although these results suggest that LM/LMM should not be considered as a subtype of CM based solely on its histological definition, it could be defined more simply as a CM with a lentiginous growth pattern and high-CSD in the dermis around it, which would tend to endorse the new WHO classification of low-CSD and high-CSD melanomas instead of SSMs and LMMs.
The strengths of the study are the prospectively built database and the statistical methodology applied.
The main limitation of the study is the low prevalence of mutations of BRAF and of the other genes analyzed.
ConclusionsThe results of the present study showed that SE grade is helpful to classify NACLMs across different groups distinguished by their clinical, pathological, and molecular features. This points out the importance of reporting the grade of SE in the pathological report. Indeed, SE grade seemed to classify NACLMs more precisely than CSD. Although the results endorse the new WHO classification of low- and high-CSD melanomas, they also hint that these two categories are opposite poles of the same disease spectrum that varies by the grade of SE. Further studies with more molecular and genetic data are needed to confirm or refute these results.
Conflict of interestEduardo Nagore is a member of the [Editorial Board, E-i-C] of Actas Dermo-Sifiliográficas and declares that he has not participated in or had access to information regarding the review and acceptance process of the manuscript. The other authors declare that they have no conflicts of interest.
The following are the supplementary data to this article: