


To analyze the characteristics of the dermatologic surgery lists and to compare different indicators of surgical productivity.
Materials and methodsThis was a retrospective, descriptive study of the routine surgical activity undertaken in the Dermatology Department of Fuenlabrada University Hospital, Madrid, Spain, between January 2005 and December 2010. Data about the procedures performed and about the surgical lists were analyzed and an analysis was made of operating room occupancy. Surgical productivity was analyzed using standard operating times (SOTs) and surgical scheduling adequacy values (SA1 and SA2). Variables were recorded as relative frequencies. Covariance and the Pearson linear correlation index were used for comparisons.
ResultsThe study period included a total of 11,481 surgical sessions, of which 71% were minor surgery and the remainder were major outpatient surgery. A mean of 9.7 operations were performed in each session and the overall operating room occupancy was 71.9%. Four SOT descriptors (minor surgery, multiple minor skin lesions, nail surgery, and malignant tumors with primary closure) were sufficient to classify 86.7% of the operations performed. The operating room down-time was 0.15 SOT (9minutes) in 91.3% of operations. The mean SA1 index was 1.20. Overall surgical productivity measured using the SA2 index was 96.46%. The Pearson correlation showed a statistically significant relationship between the increase in the number of patients per surgical session, the reduction in operating room occupancy, and the increase in SA2 operating room productivity.
ConclusionsThe application of SOT descriptors enables us to quantify the complexity of the operations included in the surgical waiting list and to obtain indicators for the evaluation of surgical activity, improving efficiency in surgical time management.
Analizar las características de las jornadas quirúrgicas dermatológicas y comparar distintos indicadores de rendimiento quirúrgico.
Material y métodoEstudio descriptivo y retrospectivo de la actividad quirúrgica programada realizada en el Servicio de Dermatología del Hospital Universitario de Fuenlabrada desde enero de 2005 a diciembre de 2010. Se analizan datos relativos a los procedimientos realizados y a las jornadas quirúrgicas. Se analizan los índices de ocupación, de rendimiento quirúrgico mediante tiempos quirúrgicos estándar (TQE) y los valores de adecuación quirúrgica AQ1 y AQ2. La medición de las variables se realiza mediante frecuencias relativas. Se ha calculado la covarianza y el índice de correlación lineal de Pearson entre distintas variables.
ResultadosDurante el periodo de estudio se realizaron 11.481 jornadas quirúrgicas. El 71% de las jornadas fueron de cirugía menor y el resto de CMA. La media de pacientes intervenidos/jornada fue de 9,7. El índice global de ocupación de quirófano fue del 71,91%. Cuatro descriptores TQE: «cirugía menor», «lesiones múltiples menores de piel», «cirugía de la uña» y «tumor maligno de piel cierre directo» fueron suficientes para clasificar el 86,7% de las cirugías realizadas. El 91,3% de las intervenciones asociaron un tiempo muerto de TQE 0.15 (9min). La media del indicador AQ1 fue de 1,20. El rendimiento de quirófano global medido mediante el indicador AQ2 fue del 96,46%. El índice de correlación de Pearson mostró relación estadísticamente significativa entre el incremento del número de pacientes/jornada, la disminución del índice de ocupación y el aumento del rendimiento de quirófano AQ2.
ConclusionesLa aplicación de los descriptores TQE permite cuantificar la complejidad de los procesos incluidos en LEQ y obtener indicadores para evaluar la actividad quirúrgica, mejorando la eficiencia en la gestión de los tiempos quirúrgicos.
Surgery accounts for a substantial part of the activity of a dermatology department. Appropriate management is essential for the surgical procedures to run smoothly. Currently, hospital activity is recorded through traditional indicators (mean duration of stay, number of admissions, mortality rate, etc.) along with data collected from patient classification systems. The diagnosis-related groups (DRGs) classify patients into homogeneous groups of similar clinical characteristics with similar resource usages.1 The information needed to classify each patient according to the DRG system is extracted from the minimum basic dataset, which is recorded for all patients admitted to hospital. The DRGs have helped define new indicators for comparing the activity of different hospital departments and different hospitals. However, they are not particularly useful as a metric for the management of surgical activity.2 It is complicated to measure the efficiency of surgical activity for several reasons. The diseases requiring surgery vary greatly in complexity; operations can range from minor procedures that can be performed in a few minutes to complicated ones that may even exceed the duration of a standard surgical shift. There is thus a need for a specific patient classification system that enables patients to be grouped into a limited number of categories for which resource usage can be readily quantified.3
From 2005 onwards, in the Madrid Health Services (SERMAS) in Spain, an approach for grouping procedures into standard operating times (SOTs) was developed. In this system, the most common interventions on the surgical waiting lists are each assigned an SOT descriptor.3 By combining data from diagnosis and procedures, extracted from the International Classification of Diseases 9 Clinical Modification codes, an SOT is obtained for each descriptor. This value is associated with the standard intervention time, the downtime, and the weighting of the descriptor. The standard intervention time is defined as the time needed for an expert surgical team to perform the intervention, measured from when the patient enters the operating room until he or she leaves it. Downtime is defined as the time necessary to prepare the operating room for the next operation. The weighting of the intervention is related to the fees charged per surgical act. The assignment of times for the different SOT groups is made through consensus of a group of experts. An SOT is considered as equivalent to 60minutes of surgery time; for shorter times, fractions of SOTs are used (for example, an SOT of 0.3 would be equivalent to 18minutes while one of 0.5 would be equivalent to 30minutes).
In order to manage the operating rooms appropriately, the number of operations that a surgical department would be able to perform in a given time should be known. This can be estimated through surgical productivity. The operating room occupancy, that is, the percentage of time that the operating room is occupied by patients compared to the total time available, is the most common approach for measuring performance. It also provides a reflection of time spent operating during a surgical shift. The occupancy is merely a mathematical calculation that does not take into account the time employed in preparing and cleaning the operating rooms between patients, and so for large numbers of interventions, occupancy is lower. Occupancy is perhaps not the most appropriate measure of productivity of a dermatology operating room, especially in the case of minor surgery, where many short interventions are performed during each surgical shift.
Good time management goes hand in hand with improved surgical productivity, with a decrease in expenditure on surgery.4 With classification into SOT groups, it is possible to measure the length of the surgical waiting list (SWL), surgical activity, and efficiency of operating room utilization through the indicators of surgical scheduling adequacy (SA1 and SA2). SA1 for a shift is calculated as the ratio of time the operating room is available (7 SOTs in a surgical shift of 7hours) and the sum of SOTs (SOT interventions+SOT downtime) scheduled according to the SWL. The SA1 indicator shows whether the surgical shift has been appropriately scheduled (value close to 1) or whether there is overbooking (SA1<1) or underbooking (SA1>1).3 The SA2 indicator reflects the portion that the total sum of SOTs for the interventions performed represents with respect to the total time available; it is thus an indicator of surgical productivity.3 The 2 indicators can be used to reflect the balance between patients entering and leaving the SWL. Given that 10% of the patients included on the SWL will usually not undergo the scheduled operation, the product SA1×SA2 should remain close to 0.9 to ensure equilibrium. With an ideal standard value for SA2 of 85%, the standard value of SA1 should be 1.06 to maintain a product of 0.9.
The aim of this study was to analyze the surgical activity in our dermatology department, comparing the different measures of productivity for the operating room, and to assess the utility of SOT in the management of a dermatology operating room.
Materials and MethodsThis was a descriptive, retrospective study of scheduled surgical activity performed in the dermatology department of Hospital Universitario de Fuenlabrada, Madrid, Spain, between January 2005 and December 2010. The Hospital Universitario de Fuenlabrada is a secondary care hospital in terms of size and services. It covers the health areas of Fuenlabrada, Moraleja de Enmedio, and Humanes of the former district 9 (until the formation of a single district in 2011), with a catchment population of approximately 225 000 inhabitants. The demographic characteristics of the district reflect a young population with a high birth rate, a high proportion of children, and a lower proportion of elderly individuals than the mean value for the Community of Madrid.
The data collected in the study were taken from the computerized Selene medical records. These include clinical information, specific forms for dermatologic surgery, nursing protocols, a record of pathology results, and the minimum basic dataset. The data were transferred to a Microsoft Excel 2003 spreadsheet for analysis. The statistical tests were performed using the SPSS 17.0 Statistical package.
The interventions performed were grouped into 13 SOT descriptors, according to the clinical information on each patient and the complexity of the procedure scheduled at the time of inclusion on the SWL. Subsequently, after surgery and once it was confirmed that the procedure had been performed, descriptors were regrouped into 18 SOTs. The procedures that did not fit in any of the predefined descriptors were included in a generic SOT descriptor for the remaining dermatologic interventions (other DER). The data on the procedures performed and the surgical shifts (number of patients operated per shift, SOT, duration of each intervention) were calculated. The variables were analyzed using relative frequencies and comparison of the means. The surgical productivity was studied using different indicators, comparing traditional occupancy with the surgical productivity assessed using SOT. The surgical adequacy measures SA1 and SA2 were calculated. The relationship between the variables was assessed by calculating the covariance and the Pearson linear correlation coefficient.
ResultsDuring the study period, 11 516 surgical procedures were performed in the dermatology department of the Hospital Universitario de Fuenlabrada. This activity was undertaken in 1184 surgical shifts and involved 11 481 patients (99.7%). Of these shifts, 80% had a standard duration of 420minutes, while 13% lasted 330minutes and 7% corresponded to evening shifts lasting 300minutes.
Seventy-one percent of the shifts (n=884) corresponded to minor surgery, while the remaining 29% (n=340) were major outpatient surgery (MOS) shifts with the participation of the anesthesiology department. Thirty-five surgical interventions were emergency procedures and not included in the programmed surgical shift. During the study period, the distribution of shifts per year remained relatively stable, with a mean of 197 shifts per year and a maximum number of shifts of 229 in 2007. The ratio of minor surgery to MOS also remained relatively stable during the study period (Fig. 1).

The mean (SD) number of patients operated on in each surgical shift throughout the whole study period was 9.7 (2.73) patients. A progressive increase in the mean number of patients per shift was observed over the years, from a minimum of 8.34 (1.66) in 2005, then 8.45 (1.87) in 2006, 9.83 (2.78) in 2007, 10.15 (2.79) in 2008, and 10.59 (2.92) in 2009, before reaching a maximum of 10.73 (2.97) in 2010. For MOS procedures and minor surgery taken separately, the mean (SD) number of patients per shift was 6.91 (1.15) and 10.82 (2.35), respectively. Likewise, by type of surgery, there was also a progressive increase during the study in the number of patients per shift from a minimum of 6.49 (0.92) for MOS and 9.21 (1.15) for minor surgery in 2005 to a maximum of 7.46 (0.93) for MOS and 12.05 (2.45) for minor surgery in 2010 (Table 1).
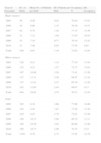
Relationship Between Patients per Shift and Occupancy According to Type of Surgery By Year.
| Year of Procedure | No. of Shifts | Mean No. of Patients per Shift | SD, Patients per Shift | Occupancy, % | SD, Occupancy |
| Major surgery | |||||
| 2005 | 59 | 6.49 | 0.92 | 78.44 | 15.01 |
| 2006 | 58 | 6.66 | 1.15 | 76.39 | 14.47 |
| 2007 | 62 | 6.74 | 1.28 | 77.33 | 13.46 |
| 2008 | 52 | 7.12 | 1.49 | 71.93 | 10.55 |
| 2009 | 52 | 7.10 | 0.77 | 70.34 | 12.42 |
| 2010 | 57 | 7.46 | 0.93 | 73.55 | 8.67 |
| Total | 340 | 6.91 | 1.16 | 74.83 | 12.93 |
| Minor surgery | |||||
| 2005 | 126 | 9.21 | 1.14 | 77.30 | 13.54 |
| 2006 | 135 | 9.21 | 1.57 | 72.37 | 12.63 |
| 2007 | 167 | 10.98 | 2.26 | 71.41 | 13.20 |
| 2008 | 137 | 11.31 | 2.26 | 68.97 | 11.24 |
| 2009 | 137 | 11.91 | 2.27 | 65.70 | 12.20 |
| 2010 | 142 | 12.05 | 2.45 | 69.07 | 9.17 |
| Total | 844 | 10.82 | 2.35 | 70.73 | 12.54 |
| Total | |||||
| 2005 | 185 | 8.34 | 1.66 | 77.66 | 14.00 |
| 2006 | 193 | 8.45 | 1.87 | 73.58 | 13.30 |
| 2007 | 229 | 9.83 | 2.78 | 73.01 | 13.50 |
| 2008 | 189 | 10.15 | 2.80 | 69.79 | 11.11 |
| 2009 | 189 | 10.59 | 2.92 | 66.98 | 12.40 |
| 2010 | 199 | 10.73 | 2.98 | 70.35 | 9.23 |
| Total | 1184 | 9.70 | 2.73 | 71.91 | 12.79 |
The overall operating room occupancy during the study period was 71.91%, with a trend towards a decrease from 77.66% in 2005 to 70.35% in 2010, and a minimum of 66.98% in 2009. The same decreasing trend is observed in the occupancy for MOS and minor surgery. At all times, the productivity of the minor surgery operating room (overall occupancy of 70.73%) was lower than that of the MOS (overall occupancy of 74.83%) (Table 1). The covariance of the variables patients per shift and occupancy was −1.85 and the Pearson linear correlation coefficient was −0.053.
Three SOT descriptors (minor surgery, nail surgery, and malignant skin tumor with direct closure) were sufficient to classify 88.3% of the procedures performed. After surgery, 86.7% of the interventions performed were reassigned to 4 SOT descriptors. In descending order of frequency, 58% (6683 procedures) were classed as minor surgery, with an SOT value of 0.35 (21 minutes), 10% (1157) as multiple minor skin lesions, 9.4% (1080) as nail surgery, and 9.3% (1068) as malignant skin tumor with direct closure, all with an SOT value of 0.46 (27minutes). The remaining descriptors (in total there were 18) were used much less frequently (Fig. 2). Most dermatologic interventions (91.3%) were associated with an SOT downtime of 0.15 (9minutes).
 assigned to the surgeries performed.")
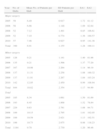
The mean of the SA1 indicator throughout the study was 1.20, with a trend towards a decrease over the years, until reaching a minimum of 0.98 in 2010. By types of surgery, the mean SA1 was 1.28 for the MOS shifts and 1.17 for the minor surgery shifts. The SA1 indicator in minor surgery showed a progressive decrease from a maximum value of 1.40 in 2005 to a minimum of 0.99 in 2010 (Table 2). The covariance of the variables patients per shift and occupancy was −0.517 and the Pearson linear correlation coefficient was −0.279 (P<.01).
Patients per Shift and SA1 and SA2 Scheduling Indicators According to Surgery Type by Year.
| Year | No. of Shifts | Mean No. of Patients per Shift | SD Patients per Shift | SA1 | SA2 |
| Major surgery | |||||
| 2005 | 59 | 6.49 | 0.917 | 1.72 | 81.12 |
| 2006 | 58 | 6.66 | 1.148 | 1.89 | 82.64 |
| 2008 | 52 | 7.12 | 1.491 | 0.85 | 106.61 |
| 2009 | 52 | 7.10 | 0.774 | 1.36 | 100.57 |
| 2010 | 57 | 7.46 | 0.927 | 0.95 | 141.38 |
| Total | 340 | 6.91 | 1.155 | 1.28 | 100.11 |
| Minor surgery | |||||
| 2005 | 126 | 9.21 | 1.141 | 1.40 | 81.96 |
| 2006 | 135 | 9.21 | 1.566 | 1.37 | 77.20 |
| 2007 | 167 | 10.98 | 2.264 | 1.14 | 96.19 |
| 2008 | 137 | 11.31 | 2.258 | 1.08 | 100.32 |
| 2009 | 137 | 11.91 | 2.267 | 1.04 | 103.24 |
| 2010 | 142 | 12.05 | 2.450 | 0.99 | 108.94 |
| Total | 844 | 10.82 | 2.354 | 1.17 | 94.99 |
| Total | |||||
| 2005 | 185 | 8.34 | 1.661 | 1.50 | 81.69 |
| 2006 | 193 | 8.45 | 1.868 | 1.52 | 78.84 |
| 2007 | 229 | 9.83 | 2.781 | 1.08 | 94.71 |
| 2008 | 189 | 10.15 | 2.795 | 1.01 | 102.05 |
| 2009 | 189 | 10.59 | 2.921 | 1.13 | 102.51 |
| 2010 | 199 | 10.73 | 2.975 | 0.98 | 118.23 |
| Total | 1184 | 9.70 | 2.730 | 1.20 | 96.46 |
The overall operating room productivity measured with the SA2 indicator was 96.46%, with an increase from the value of 81.69% at the start of the study to 118.23% in 2010. The productivity of the MOS shifts ranged from a minimum of 81.12% in 2005 to a maximum of 141.38% in 2010. The minor surgery shifts also showed a trend towards increased surgical productivity during the study period, with a minimum of 77.20% in 2006 and a maximum of 108.94% in 2010 (Table 2). The covariance of the variables patients per shift and operating room productivity measured with SA2 was 26.019 and the Pearson linear correlation coefficient was 0.297 (P<.01).
The product of the SA1 and SA2 indicators, both for minor surgery and MOS, during the study period, remained close to or above 0.9 (Figs. 3 and 4).
 and SA2 (operating room productivity) by year for major outpatient surgery.")
 and SA2 (operating room productivity) by year for minor surgery.")
The surgical activity in our dermatology department has increased progressively over recent years. The clear increase in activity, both for minor surgery and MOS, was driven by the increase in the number of patients operated on in each shift, given that the number of surgical shifts per year remained relatively stable during the study period. The overall occupancy of the dermatology operating room was 71.91%, which is similar to that reported for other series, where it ranges from 70% to 85%.5 It is thought that implementation of measures to ensure a punctual start to the surgical shift, a decrease in the downtimes between surgery, and an increase in the number of patients scheduled per shift increases occupancy in all surgical departments.5 However, in our case, occupancy did not improve but actually worsened after an increase in the number of patients per surgical shift, probably as a result of the downtime between interventions. The negative covariance value shows that there is an inverse relationship between the 2 variables, and so it does not appear that increasing the number of patients is a useful way of improving occupancy in dermatology surgery.
The classification into SOT groups considers the standard time that it would take to carry out an intervention, according to the complexity and patient characteristics and the downtime associated with a given intervention. This allows the available time to be better managed and appropriate planning of surgical resources. In general, it is considered that there is a good correlation between the real durations of each intervention and the SOT value established for each group. This correlation is higher for interventions of less than 2hours, as would be the case for most dermatological interventions.3
A relatively small number of SOT descriptors may be sufficient to define most of the surgical activity. In our study, 17 descriptors in total were used, but 4 were sufficient to classify 86.7% of the interventions. Although classification into SOT has obvious advantages for standardization, and facilitates diagnostic and procedural coding, it does not cover some interventions which are included generically as other DER. Likewise, it does not asses the possibility of correcting the times in university hospitals or surgery performed by residents, both cases where the operations may take longer.2
Classification by SOT allowed the surgical adequacy measures SA1 and SA2 to be assessed. The overall SA1 value in our study was 1.20, with a progressive decline and a tendency to approach and even dip below the standard value of 1.06; this tendency was particularly marked for minor surgery. The decrease in SA1 was significantly correlated with the increased number of patients per shift, an observation that points to improved surgical scheduling over the years.
The overall operating room productivity measured with the SA2 indicator was 96.46%. There are no other series of data published for dermatologic surgery with which to compare, but this value is above 85%, and so is considered the ideal standard.3 Over the years, there was a progressive increase in the productivity measured with SA2, both for MOS and for minor surgery, and this increase correlated with an increase in the number of patients operated on per surgical shift. There was also a statistically significant association between these 2 variables. The SA1 and SA2 indicators better reflect the efforts to increase the surgical activity in the department over the last few years.
With the SA1 and SA2 indicators, it is possible to provide a graphical representation in which the product SA1xSA2=0.9 plots an equilibrium curve, above which the SWL is reduced because the interventions would exceed 90% of the entries, measured with SOT.3 If the data are broken down by year, it is observed that minor surgery always remains above the equilibrium line and MOS does so for most years. This reflects good management of the SWL. Over the years, the ratio of SA1 to SA2 indicators remains more stable for minor surgery than for MOS, probably as a result of the greater complexity and variability of the MOS procedures.
With classification into SOT descriptors, it is possible to quantify the complexity of the procedures on the SWL and obtain indicators to assess surgical activity, thereby improving the efficiency of the management of the surgical times. It also allows a comparison of the activity performed by different professionals, surgical departments, and hospitals. The approach can thus show which surgery is more efficient from the point of view of SA2, assessing both the complexity of the procedures performed and the time needed to carry them out.
The increase in the number of patients operated per shift was followed by a decrease in the operating room occupancy, particularly in the case of minor surgery, due to the increase in downtime between patients. The application of SOT allows a comparison of like with like to be made between surgical departments of traditional importance, such as general surgery or traumatology, and other departments with a very different surgical profile such as dermatology. The grouping of SOT descriptors is a useful management tool but it needs regular review and updating to ensure that it tracks the changes in surgical practice. The optimal functionality of this tool will depend on an appropriate coding of the times and procedures prior to and after surgery by the professionals involved.
Awareness on the part of surgeons of these basic management tools will enable better organization of the surgical activity, and hence an improvement in the care provided.
Conflicts of InterestThe authors declare that they have no conflicts of interest.
Please cite this article as: Córdoba S, et al. Análisis de la actividad quirúrgica realizada en el Servicio de Dermatología del Hospital Universitario de Fuenlabrada (2005-2010): establecimiento de los tiempos quirúrgicos estándar. Actas Dermosifiliogr. 2013;104:141–7.


