


The cost of treating cutaneous T-cell lymphoma (CTCL) in Spain is unknown. With the advent of new treatments, it is more important than ever to gain an accurate picture of the true costs involved. The MICADOS study had 2 primary objectives: 1)to evaluate the impact of CTCL on patient quality of life, and 2)to evaluate the costs associated with the disease. This article reports the results of the cost analysis.
MethodsWe estimated the cost of treating CTCL over a period of 1year from the perspective of the Spanish National Health System. Twenty-three dermatologists and hematologists from 15 public hospitals analyzed data for adult patients with mycosis fungoides (MF) or Sézary syndrome (SS).
ResultsA total of 141 patients (57.4% male) with a mean age of 63.6 years (95%CI: 61.4-65.7 years) were included. The mean direct annual cost of treating CTCL was €34,214 per patient. The corresponding costs by stage were €11,952.47 for stageI disease, €23,506.21 for stageII disease, €38,771.81 for stageIII disease, and €72,748.84 for stageIV disease. The total direct annual cost of treating MF/SS in public hospitals in Spain was estimated at €78,301,171; stageI disease accounted for 81% of all costs, stageII for 7%, and stagesIII andIV for 6% each.
ConclusionsThe MICADOS study offers an accurate picture of the direct cost of treating CTCL in patients with MF/SS in Spain and shows that costs vary significantly according to disease stage. Patient-borne and indirect costs should be analyzed in future studies.
No se dispone de datos españoles sobre el coste asociado al linfoma cutáneo de célulasT (LCCT). Además, la incorporación de nuevos tratamientos hace necesario analizar el coste real de la enfermedad. El estudio MICADOS analizó dos objetivos principales: Por un lado, evaluó el impacto en la calidad de vida en los pacientes con LCCT, y por otro lado, estudió los costes de la enfermedad. En esta publicación se recoge el segundo de los objetivos del estudio.
MétodosEl coste de la enfermedad se estudió bajo la perspectiva del Sistema Nacional de Salud (SNS) con un horizonte temporal de un año. Participaron 23 dermatólogos y hematólogos de 15 hospitales públicos españoles. Se incluyeron pacientes adultos con LCCT del tipo micosis fungoide (MF) y síndrome de Sézary (SS).
ResultadosSe incluyeron 141 pacientes, el 57,4% masculinos, con una edad media de 63,6 años (IC95%: 61,4-65,7). Los costes directos anuales medios por pacientes del estudio fueron de 34.214€, siendo de 11.952,47€ en estadioI, 23.506,21€ en estadioII, 38.771,81€ en estadioIII y 72.748,84€ en estadioIV. El coste anual directo total estimado de todos los pacientes en España con MF/SS resultó en 78.301.171€, donde el 81% de los costes fueron atribuibles a pacientes en estadioI, el 7% al estadioII, el 6% al estadioIII y el 6% al estadioIV.
ConclusionesEste estudio ofrece una evaluación precisa del coste directo del LCCT en pacientes con MF/SS en España, mostrando costes que varían sustancialmente en función del estadio. Los costes soportados por el paciente y los costes indirectos deberán considerarse en futuras investigaciones.
Cutaneous T-cell lymphoma (CTCL) is considered a rare disease due to its low incidence rate (2.9-3.9/1,000,000 people in Europe).1,2 More than two thirds of all cases of CTCL are mycosis fungoides (MF) and Sézary syndrome (SS).3
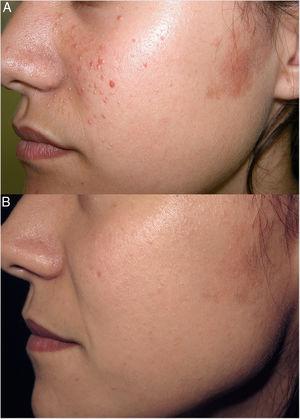
At the onset of the disease, patients present with skin lesions in the form of patches, plaques, or tumors. The lymphoma can spread to peripheral blood, lymph nodes, and internal organs, thus worsening prognosis.4,5 As the disease progresses, the prognosis becomes even grimmer, with survival dropping from 35.5 years in stage IA to <5 years from stage IIB.6,7
The European Society of Medical Oncology (ESMO) and the European Organization for Research and Treatment of Cancer (EORTC) recommend different therapies depending on the patient's clinical stage.5,8,9 In Spain, the registry from the Spanish cutaneous lymphoma group from 2008 revealed that the most widely administered skin-directed therapies were topical corticosteroids (90.8% of the patients), followed by PUVA (47.1%), and NB-UVB phototherapy (35.3%). Regarding systemic therapies, the most widely administered ones were interferon-alpha (12.1%), systemic chemotherapy (8.6%), and systemic retinoids (6.9%).10
The main objective of this study was to determine the spending associated with this disease in patients with MF/SS, in Spain, based on their clinical stage, and explore the sociodemographic and clinical factors that may be associated with higher spending.
MethodsThis was an observational, cross-sectional, retrospective study designed and approved by Hospital Universitario 12 de Octubre Research Ethics Committee, Madrid, Spain in January 14, 2020 (code 20/018). The study followed the recommendations established by cost-of-illness and financial assessment studies (CHEERS).11
A total of 23 dermatologists and hematologists from 15 Spanish public hospitals participated in the study, including patients from May 2020 through January 2021.
The look on this study was that of the Spanish National Health System (SNS) with a 1-year time horizon without applying discount rates. Results are expressed in euros (€) with 2020 inflation rates (taxes included).
The study included patients of both sexes older than 18 years, with an anatomopathological diagnosis of CTCL of MF or SS type according to the WHO classification,12 confirmed, at least, 1 year prior to being included in the study, at any stage. Patients gave their prior written informed consent.
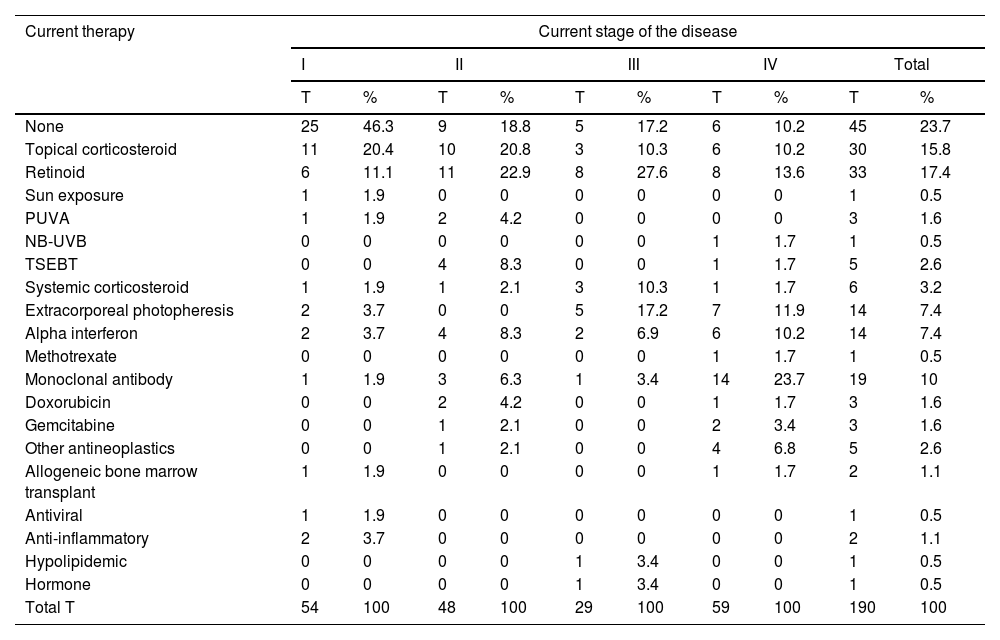
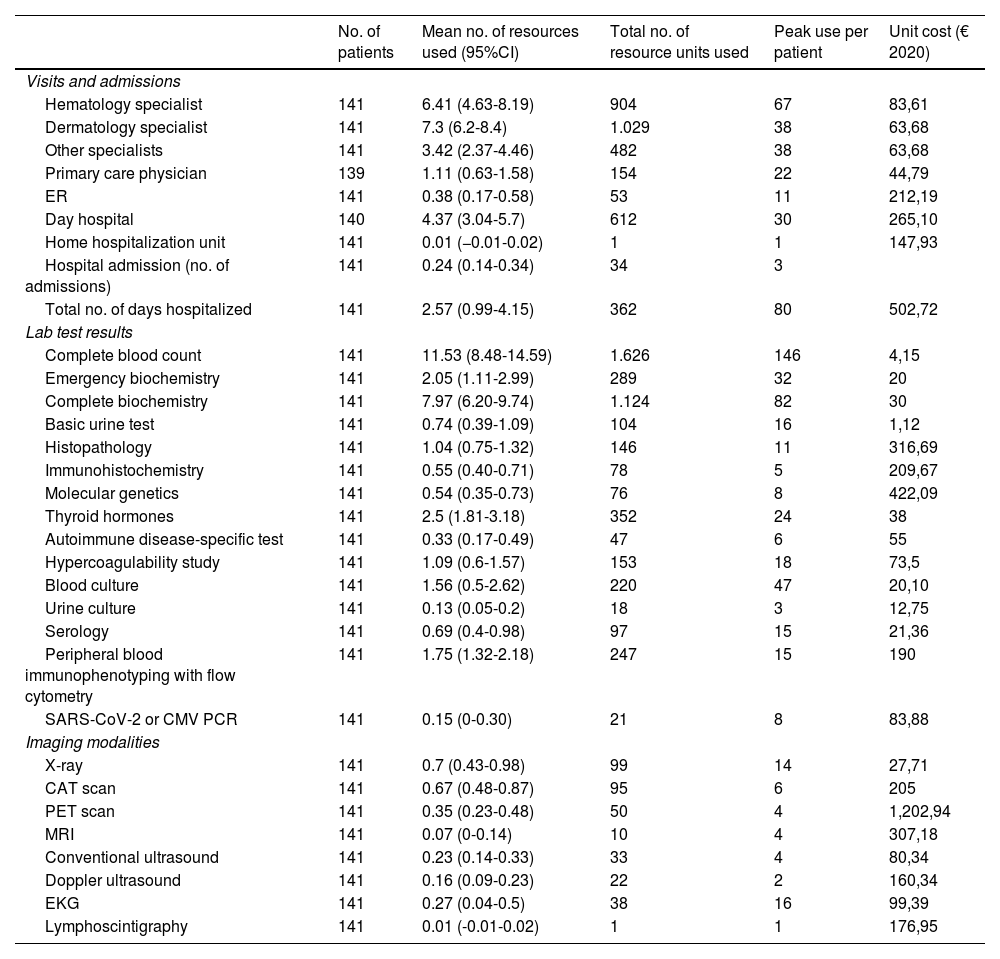
For the study primary endpoint, an economic model was designed to collect information at the time of the study and during the previous year. This model included the commercial name or type of intervention, the unit dose and its units, the number of daily doses administered, the route of administration, and the date treatment started and ended. The number of units consumed by each health care resource, including visits and admissions, lab test results, and imaging studies, were also included. The therapies patients were on at the time of the study are shown in table 1, while the unit costs of health care resources, and the pharmacological and non-pharmacological treatments are shown in table 2 and table 3. Supplementary table 1 (supplementary data) shows the cost of non-pharmacological therapeutic interventions based on the number of patients and sessions during the last year.
Therapies administered to patients at the present time.
| Current therapy | Current stage of the disease | |||||||||
|---|---|---|---|---|---|---|---|---|---|---|
| I | II | III | IV | Total | ||||||
| T | % | T | % | T | % | T | % | T | % | |
| None | 25 | 46.3 | 9 | 18.8 | 5 | 17.2 | 6 | 10.2 | 45 | 23.7 |
| Topical corticosteroid | 11 | 20.4 | 10 | 20.8 | 3 | 10.3 | 6 | 10.2 | 30 | 15.8 |
| Retinoid | 6 | 11.1 | 11 | 22.9 | 8 | 27.6 | 8 | 13.6 | 33 | 17.4 |
| Sun exposure | 1 | 1.9 | 0 | 0 | 0 | 0 | 0 | 0 | 1 | 0.5 |
| PUVA | 1 | 1.9 | 2 | 4.2 | 0 | 0 | 0 | 0 | 3 | 1.6 |
| NB-UVB | 0 | 0 | 0 | 0 | 0 | 0 | 1 | 1.7 | 1 | 0.5 |
| TSEBT | 0 | 0 | 4 | 8.3 | 0 | 0 | 1 | 1.7 | 5 | 2.6 |
| Systemic corticosteroid | 1 | 1.9 | 1 | 2.1 | 3 | 10.3 | 1 | 1.7 | 6 | 3.2 |
| Extracorporeal photopheresis | 2 | 3.7 | 0 | 0 | 5 | 17.2 | 7 | 11.9 | 14 | 7.4 |
| Alpha interferon | 2 | 3.7 | 4 | 8.3 | 2 | 6.9 | 6 | 10.2 | 14 | 7.4 |
| Methotrexate | 0 | 0 | 0 | 0 | 0 | 0 | 1 | 1.7 | 1 | 0.5 |
| Monoclonal antibody | 1 | 1.9 | 3 | 6.3 | 1 | 3.4 | 14 | 23.7 | 19 | 10 |
| Doxorubicin | 0 | 0 | 2 | 4.2 | 0 | 0 | 1 | 1.7 | 3 | 1.6 |
| Gemcitabine | 0 | 0 | 1 | 2.1 | 0 | 0 | 2 | 3.4 | 3 | 1.6 |
| Other antineoplastics | 0 | 0 | 1 | 2.1 | 0 | 0 | 4 | 6.8 | 5 | 2.6 |
| Allogeneic bone marrow transplant | 1 | 1.9 | 0 | 0 | 0 | 0 | 1 | 1.7 | 2 | 1.1 |
| Antiviral | 1 | 1.9 | 0 | 0 | 0 | 0 | 0 | 0 | 1 | 0.5 |
| Anti-inflammatory | 2 | 3.7 | 0 | 0 | 0 | 0 | 0 | 0 | 2 | 1.1 |
| Hypolipidemic | 0 | 0 | 0 | 0 | 1 | 3.4 | 0 | 0 | 1 | 0.5 |
| Hormone | 0 | 0 | 0 | 0 | 1 | 3.4 | 0 | 0 | 1 | 0.5 |
| Total T | 54 | 100 | 48 | 100 | 29 | 100 | 59 | 100 | 190 | 100 |
Other antineoplastics: neoplastic drugs are not listed in the table; NB-UVB, narrow-band ultraviolet B phototherapy; PUVA, phototherapy with psoralens and ultraviolet A light; T, no. of therapies of each type in current treatment; the total sum of therapies does not match the total no. of patients because a single patient can receive >1 therapy simultaneously; TSEBT, total skin electron beam therapy.
Use of health care resources within the last year and unit cost per resource.
| No. of patients | Mean no. of resources used (95%CI) | Total no. of resource units used | Peak use per patient | Unit cost (€ 2020) | |
|---|---|---|---|---|---|
| Visits and admissions | |||||
| Hematology specialist | 141 | 6.41 (4.63-8.19) | 904 | 67 | 83,61 |
| Dermatology specialist | 141 | 7.3 (6.2-8.4) | 1.029 | 38 | 63,68 |
| Other specialists | 141 | 3.42 (2.37-4.46) | 482 | 38 | 63,68 |
| Primary care physician | 139 | 1.11 (0.63-1.58) | 154 | 22 | 44,79 |
| ER | 141 | 0.38 (0.17-0.58) | 53 | 11 | 212,19 |
| Day hospital | 140 | 4.37 (3.04-5.7) | 612 | 30 | 265,10 |
| Home hospitalization unit | 141 | 0.01 (−0.01-0.02) | 1 | 1 | 147,93 |
| Hospital admission (no. of admissions) | 141 | 0.24 (0.14-0.34) | 34 | 3 | |
| Total no. of days hospitalized | 141 | 2.57 (0.99-4.15) | 362 | 80 | 502,72 |
| Lab test results | |||||
| Complete blood count | 141 | 11.53 (8.48-14.59) | 1.626 | 146 | 4,15 |
| Emergency biochemistry | 141 | 2.05 (1.11-2.99) | 289 | 32 | 20 |
| Complete biochemistry | 141 | 7.97 (6.20-9.74) | 1.124 | 82 | 30 |
| Basic urine test | 141 | 0.74 (0.39-1.09) | 104 | 16 | 1,12 |
| Histopathology | 141 | 1.04 (0.75-1.32) | 146 | 11 | 316,69 |
| Immunohistochemistry | 141 | 0.55 (0.40-0.71) | 78 | 5 | 209,67 |
| Molecular genetics | 141 | 0.54 (0.35-0.73) | 76 | 8 | 422,09 |
| Thyroid hormones | 141 | 2.5 (1.81-3.18) | 352 | 24 | 38 |
| Autoimmune disease-specific test | 141 | 0.33 (0.17-0.49) | 47 | 6 | 55 |
| Hypercoagulability study | 141 | 1.09 (0.6-1.57) | 153 | 18 | 73,5 |
| Blood culture | 141 | 1.56 (0.5-2.62) | 220 | 47 | 20,10 |
| Urine culture | 141 | 0.13 (0.05-0.2) | 18 | 3 | 12,75 |
| Serology | 141 | 0.69 (0.4-0.98) | 97 | 15 | 21,36 |
| Peripheral blood immunophenotyping with flow cytometry | 141 | 1.75 (1.32-2.18) | 247 | 15 | 190 |
| SARS-CoV-2 or CMV PCR | 141 | 0.15 (0-0.30) | 21 | 8 | 83,88 |
| Imaging modalities | |||||
| X-ray | 141 | 0.7 (0.43-0.98) | 99 | 14 | 27,71 |
| CAT scan | 141 | 0.67 (0.48-0.87) | 95 | 6 | 205 |
| PET scan | 141 | 0.35 (0.23-0.48) | 50 | 4 | 1,202,94 |
| MRI | 141 | 0.07 (0-0.14) | 10 | 4 | 307,18 |
| Conventional ultrasound | 141 | 0.23 (0.14-0.33) | 33 | 4 | 80,34 |
| Doppler ultrasound | 141 | 0.16 (0.09-0.23) | 22 | 2 | 160,34 |
| EKG | 141 | 0.27 (0.04-0.5) | 38 | 16 | 99,39 |
| Lymphoscintigraphy | 141 | 0.01 (-0.01-0.02) | 1 | 1 | 176,95 |
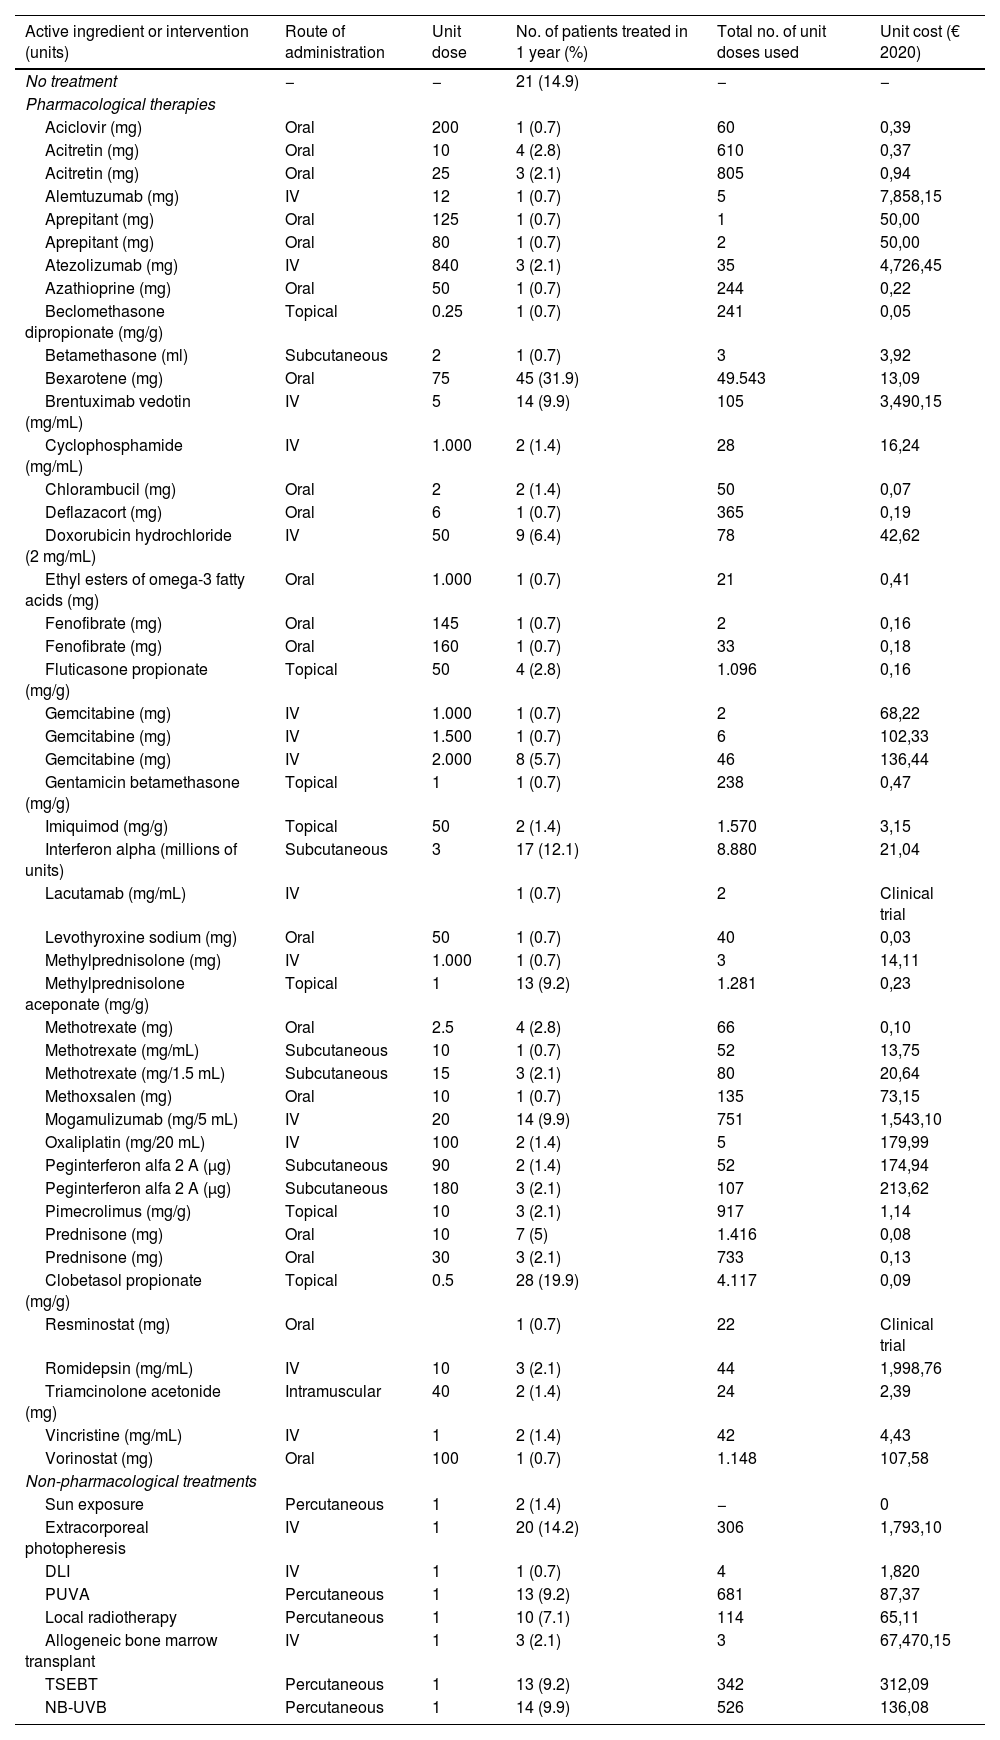
Use of pharmacological and non-pharmacological therapies within the last year and their unit costs.
| Active ingredient or intervention (units) | Route of administration | Unit dose | No. of patients treated in 1 year (%) | Total no. of unit doses used | Unit cost (€ 2020) |
|---|---|---|---|---|---|
| No treatment | − | − | 21 (14.9) | − | − |
| Pharmacological therapies | |||||
| Aciclovir (mg) | Oral | 200 | 1 (0.7) | 60 | 0,39 |
| Acitretin (mg) | Oral | 10 | 4 (2.8) | 610 | 0,37 |
| Acitretin (mg) | Oral | 25 | 3 (2.1) | 805 | 0,94 |
| Alemtuzumab (mg) | IV | 12 | 1 (0.7) | 5 | 7,858,15 |
| Aprepitant (mg) | Oral | 125 | 1 (0.7) | 1 | 50,00 |
| Aprepitant (mg) | Oral | 80 | 1 (0.7) | 2 | 50,00 |
| Atezolizumab (mg) | IV | 840 | 3 (2.1) | 35 | 4,726,45 |
| Azathioprine (mg) | Oral | 50 | 1 (0.7) | 244 | 0,22 |
| Beclomethasone dipropionate (mg/g) | Topical | 0.25 | 1 (0.7) | 241 | 0,05 |
| Betamethasone (ml) | Subcutaneous | 2 | 1 (0.7) | 3 | 3,92 |
| Bexarotene (mg) | Oral | 75 | 45 (31.9) | 49.543 | 13,09 |
| Brentuximab vedotin (mg/mL) | IV | 5 | 14 (9.9) | 105 | 3,490,15 |
| Cyclophosphamide (mg/mL) | IV | 1.000 | 2 (1.4) | 28 | 16,24 |
| Chlorambucil (mg) | Oral | 2 | 2 (1.4) | 50 | 0,07 |
| Deflazacort (mg) | Oral | 6 | 1 (0.7) | 365 | 0,19 |
| Doxorubicin hydrochloride (2 mg/mL) | IV | 50 | 9 (6.4) | 78 | 42,62 |
| Ethyl esters of omega-3 fatty acids (mg) | Oral | 1.000 | 1 (0.7) | 21 | 0,41 |
| Fenofibrate (mg) | Oral | 145 | 1 (0.7) | 2 | 0,16 |
| Fenofibrate (mg) | Oral | 160 | 1 (0.7) | 33 | 0,18 |
| Fluticasone propionate (mg/g) | Topical | 50 | 4 (2.8) | 1.096 | 0,16 |
| Gemcitabine (mg) | IV | 1.000 | 1 (0.7) | 2 | 68,22 |
| Gemcitabine (mg) | IV | 1.500 | 1 (0.7) | 6 | 102,33 |
| Gemcitabine (mg) | IV | 2.000 | 8 (5.7) | 46 | 136,44 |
| Gentamicin betamethasone (mg/g) | Topical | 1 | 1 (0.7) | 238 | 0,47 |
| Imiquimod (mg/g) | Topical | 50 | 2 (1.4) | 1.570 | 3,15 |
| Interferon alpha (millions of units) | Subcutaneous | 3 | 17 (12.1) | 8.880 | 21,04 |
| Lacutamab (mg/mL) | IV | 1 (0.7) | 2 | Clinical trial | |
| Levothyroxine sodium (mg) | Oral | 50 | 1 (0.7) | 40 | 0,03 |
| Methylprednisolone (mg) | IV | 1.000 | 1 (0.7) | 3 | 14,11 |
| Methylprednisolone aceponate (mg/g) | Topical | 1 | 13 (9.2) | 1.281 | 0,23 |
| Methotrexate (mg) | Oral | 2.5 | 4 (2.8) | 66 | 0,10 |
| Methotrexate (mg/mL) | Subcutaneous | 10 | 1 (0.7) | 52 | 13,75 |
| Methotrexate (mg/1.5 mL) | Subcutaneous | 15 | 3 (2.1) | 80 | 20,64 |
| Methoxsalen (mg) | Oral | 10 | 1 (0.7) | 135 | 73,15 |
| Mogamulizumab (mg/5 mL) | IV | 20 | 14 (9.9) | 751 | 1,543,10 |
| Oxaliplatin (mg/20 mL) | IV | 100 | 2 (1.4) | 5 | 179,99 |
| Peginterferon alfa 2 A (μg) | Subcutaneous | 90 | 2 (1.4) | 52 | 174,94 |
| Peginterferon alfa 2 A (μg) | Subcutaneous | 180 | 3 (2.1) | 107 | 213,62 |
| Pimecrolimus (mg/g) | Topical | 10 | 3 (2.1) | 917 | 1,14 |
| Prednisone (mg) | Oral | 10 | 7 (5) | 1.416 | 0,08 |
| Prednisone (mg) | Oral | 30 | 3 (2.1) | 733 | 0,13 |
| Clobetasol propionate (mg/g) | Topical | 0.5 | 28 (19.9) | 4.117 | 0,09 |
| Resminostat (mg) | Oral | 1 (0.7) | 22 | Clinical trial | |
| Romidepsin (mg/mL) | IV | 10 | 3 (2.1) | 44 | 1,998,76 |
| Triamcinolone acetonide (mg) | Intramuscular | 40 | 2 (1.4) | 24 | 2,39 |
| Vincristine (mg/mL) | IV | 1 | 2 (1.4) | 42 | 4,43 |
| Vorinostat (mg) | Oral | 100 | 1 (0.7) | 1.148 | 107,58 |
| Non-pharmacological treatments | |||||
| Sun exposure | Percutaneous | 1 | 2 (1.4) | − | 0 |
| Extracorporeal photopheresis | IV | 1 | 20 (14.2) | 306 | 1,793,10 |
| DLI | IV | 1 | 1 (0.7) | 4 | 1,820 |
| PUVA | Percutaneous | 1 | 13 (9.2) | 681 | 87,37 |
| Local radiotherapy | Percutaneous | 1 | 10 (7.1) | 114 | 65,11 |
| Allogeneic bone marrow transplant | IV | 1 | 3 (2.1) | 3 | 67,470,15 |
| TSEBT | Percutaneous | 1 | 13 (9.2) | 342 | 312,09 |
| NB-UVB | Percutaneous | 1 | 14 (9.9) | 526 | 136,08 |
DLI, donor lymphocyte infusion; NB-UVB, narrow-band ultraviolet B phototherapy; PUVA, phototherapy with psoralens and ultraviolet A light; TSEBT, total skin electron beam therapy.
Medical spending was calculated by multiplying the number of resources used by their unit cost. These unit costs were calculated based on the average public prices in 6 different Spanish autonomous communities: Andalusia, Castille and León, Galicia, Murcia, Madrid, and the Basque Country.13–18
The Spanish Ministry of Health and Consumption Vademecum Nomenclátor (https://www.vademecum.es/) was used as the reference for the unit costs of pharmacological treatments.19 The cost of drugs not marketed in Spain were obtained from international databases.20,21
The cost of non-pharmacological treatments were estimated using the average public prices of the different autonomous communities13–18 and Ortiz-Romero et al.’s reference.22
Information on age, sex, race, diseases currently being treated, weight, height, date of diagnostic pathology results, and type of CTCL was collected as well. This information was recorded at the time of diagnosis and while the study was being conducted, including TNMB classification, clinical stage,5 ECOG functional status, and normal or elevated lactate dehydrogenase (LDH) levels. The patients completed the EORTC-QLQ-C30 version 3 questionnaire to assess cancer patients’ health-related quality of life.23
To calculate the size of the sample, the monthly spending on metastatic breast cancer in Spain (€1489) was used as a reference. With a standard deviation of €250, a 95% confidence interval, and a €41.68 precision for the mean, a sample of 140 patients was deemed necessary.24
The descriptive analysis of quantitative variables was performed with their mean and 95% confidence interval, using the Student's t-test for independent data, or ANOVA with Bonferroni correction, or the Games-Howell test for error control through multiple comparisons. Qualitative variables were expressed as frequencies and percentages for each category and analyzed using Fisher's exact test or the chi-square test.1 Since data on spending did not follow a normal distribution, linear regression models were used, adjusting for those variables that could be associated with the use of resources. Dependent variables, such as the overall spending, as well as different subtypes of spending analyzed were logarithmically transformed.25 The multivariate generalized linear model of the overall spending per patient based on different covariables was used, selecting the Gamma family and the logit link function since they showed the lowest AIC statistic of all. The significance level considered was 5%. The IBM-SPSS 27.0 software package was used for statistical analysis.
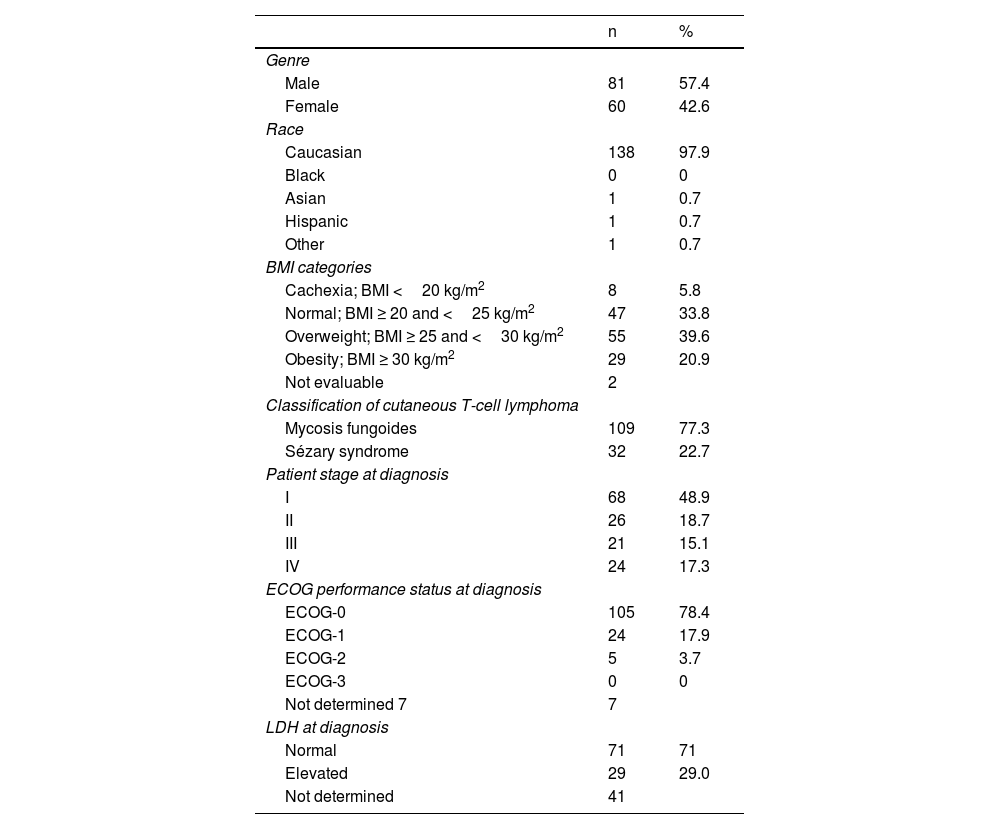
ResultsA total of 141 patients participated in the study, with a mean age of 63.6 years (95%CI, 61.4-65.7), 77.3% and 22.7% of whom had MF and SS, respectively. The patients’ demographic, anthropometric, and clinical data are shown in table 4. The patients’ mean age at the time of diagnosis was 56.2 years (95%CI, 53.9-58.6). The mean course of the disease since diagnosis was 6.7 years (95%CI, 5.8-7.6). Clinical stage was IA in 37 patients (26.2%), IB in 12 (8.5%), IIA in 6 (4.3%), IIB in 31 (22%), IIIA in 13 (9.2%), IIIB in 4 (2.8%), IVA1 in 21 (14.9%), IVA2 in 15 (10.6%), and IVB in 2 patients (1.4%). This means that 39% of the patients were in the early stages of the disease (IA, IB, and IIA) while 61% were in advanced stages.
Patients’ demographic, anthropometric, and clinical data.
| n | % | |
|---|---|---|
| Genre | ||
| Male | 81 | 57.4 |
| Female | 60 | 42.6 |
| Race | ||
| Caucasian | 138 | 97.9 |
| Black | 0 | 0 |
| Asian | 1 | 0.7 |
| Hispanic | 1 | 0.7 |
| Other | 1 | 0.7 |
| BMI categories | ||
| Cachexia; BMI <20 kg/m2 | 8 | 5.8 |
| Normal; BMI ≥ 20 and <25 kg/m2 | 47 | 33.8 |
| Overweight; BMI ≥ 25 and <30 kg/m2 | 55 | 39.6 |
| Obesity; BMI ≥ 30 kg/m2 | 29 | 20.9 |
| Not evaluable | 2 | |
| Classification of cutaneous T-cell lymphoma | ||
| Mycosis fungoides | 109 | 77.3 |
| Sézary syndrome | 32 | 22.7 |
| Patient stage at diagnosis | ||
| I | 68 | 48.9 |
| II | 26 | 18.7 |
| III | 21 | 15.1 |
| IV | 24 | 17.3 |
| ECOG performance status at diagnosis | ||
| ECOG-0 | 105 | 78.4 |
| ECOG-1 | 24 | 17.9 |
| ECOG-2 | 5 | 3.7 |
| ECOG-3 | 0 | 0 |
| Not determined 7 | 7 | |
| LDH at diagnosis | ||
| Normal | 71 | 71 |
| Elevated | 29 | 29.0 |
| Not determined | 41 | |
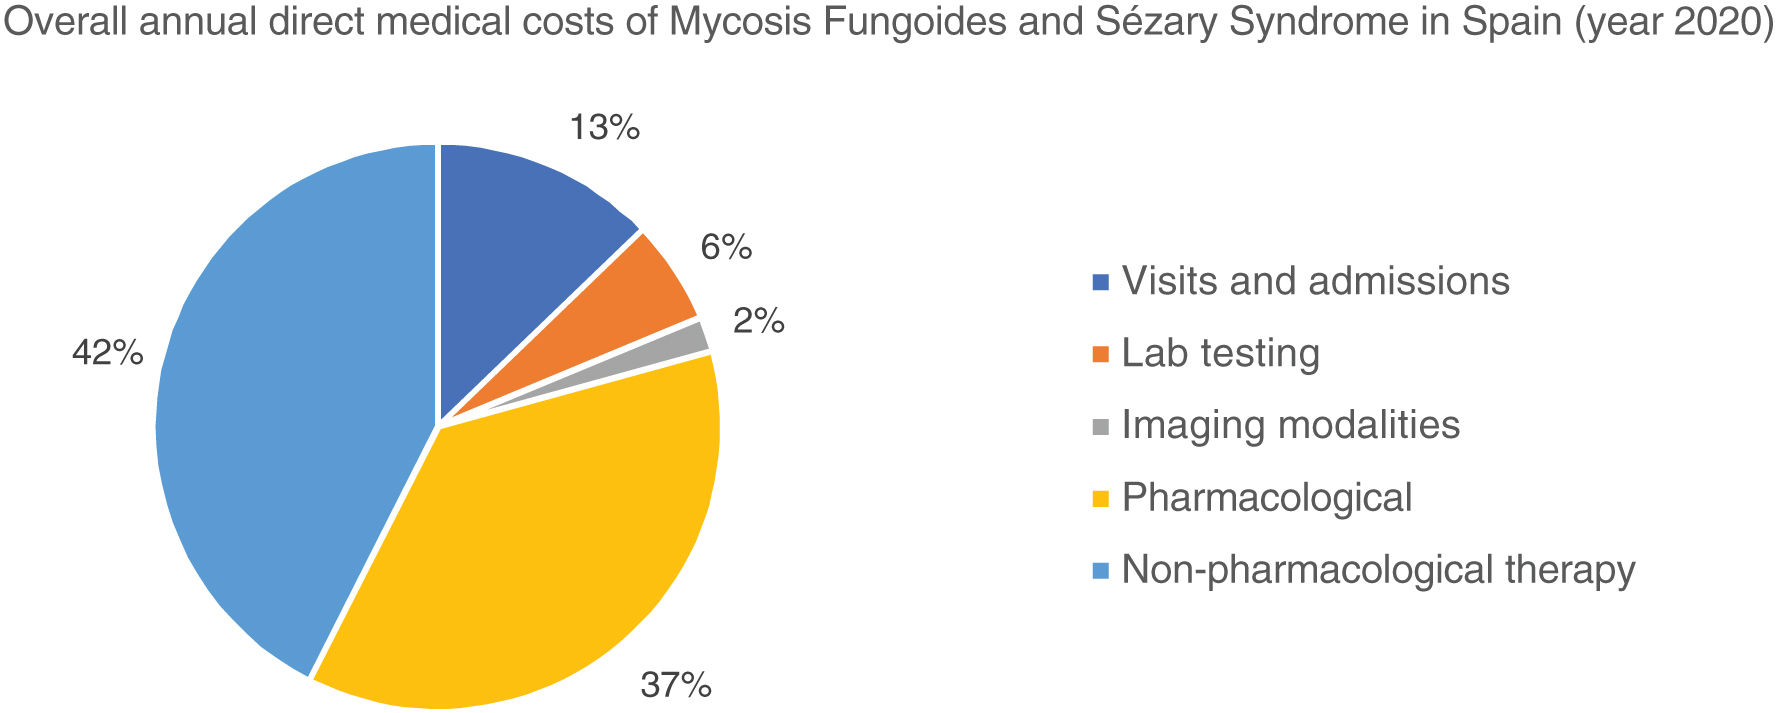
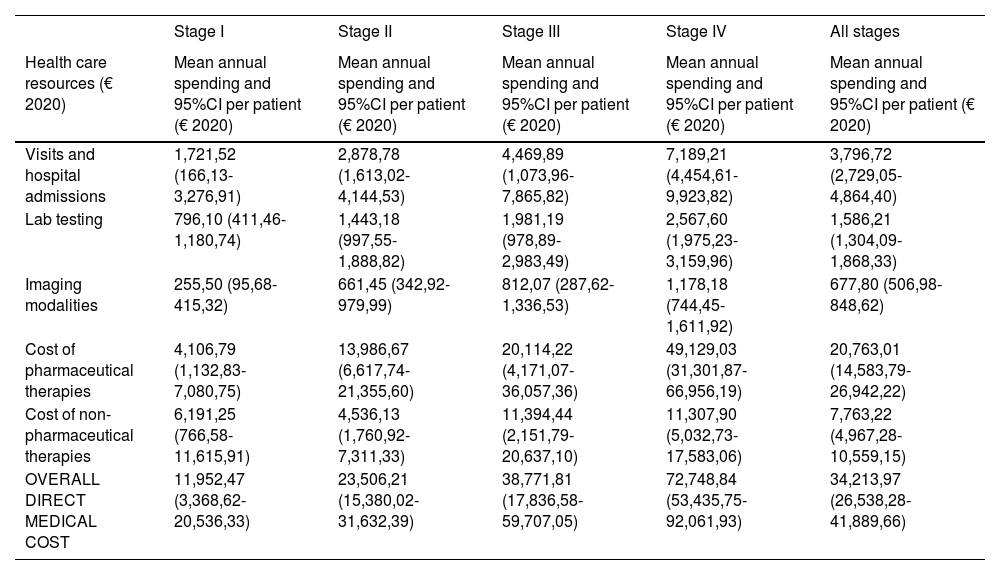
The overall annual direct medical cost of MF/SS was €78,301,171, 42% of which corresponded to pharmacological treatments, 37% to non-pharmacological treatments, 13% were costs derived from visits and admissions, 6% costs associated with lab testing, and 2% imaging costs (table 6; fig. 1). The mean annual direct cost per patient (€34,214.97) increased parallel to the stage of the disease (from €11,952.47 in stage I to €72,748.84 in stage IV). Statistically significant differences were seen between stage I and stage IV patients (P<.0001), stage II vs IV patients (P<.0001), and stage III vs IV patients (P=.021) (table 5).

Mean annual direct medical cost per patient associated with disease stage and overall health status itemized by type of health care resource and pharmacological and non-pharmacological therapy used.
| Stage I | Stage II | Stage III | Stage IV | All stages | |
|---|---|---|---|---|---|
| Health care resources (€ 2020) | Mean annual spending and 95%CI per patient (€ 2020) | Mean annual spending and 95%CI per patient (€ 2020) | Mean annual spending and 95%CI per patient (€ 2020) | Mean annual spending and 95%CI per patient (€ 2020) | Mean annual spending and 95%CI per patient (€ 2020) |
| Visits and hospital admissions | 1,721,52 (166,13-3,276,91) | 2,878,78 (1,613,02-4,144,53) | 4,469,89 (1,073,96-7,865,82) | 7,189,21 (4,454,61-9,923,82) | 3,796,72 (2,729,05-4,864,40) |
| Lab testing | 796,10 (411,46-1,180,74) | 1,443,18 (997,55-1,888,82) | 1,981,19 (978,89-2,983,49) | 2,567,60 (1,975,23-3,159,96) | 1,586,21 (1,304,09-1,868,33) |
| Imaging modalities | 255,50 (95,68-415,32) | 661,45 (342,92-979,99) | 812,07 (287,62-1,336,53) | 1,178,18 (744,45-1,611,92) | 677,80 (506,98-848,62) |
| Cost of pharmaceutical therapies | 4,106,79 (1,132,83-7,080,75) | 13,986,67 (6,617,74-21,355,60) | 20,114,22 (4,171,07-36,057,36) | 49,129,03 (31,301,87-66,956,19) | 20,763,01 (14,583,79-26,942,22) |
| Cost of non-pharmaceutical therapies | 6,191,25 (766,58-11,615,91) | 4,536,13 (1,760,92-7,311,33) | 11,394,44 (2,151,79-20,637,10) | 11,307,90 (5,032,73-17,583,06) | 7,763,22 (4,967,28-10,559,15) |
| OVERALL DIRECT MEDICAL COST | 11,952,47 (3,368,62-20,536,33) | 23,506,21 (15,380,02-31,632,39) | 38,771,81 (17,836,58-59,707,05) | 72,748,84 (53,435,75-92,061,93) | 34,213,97 (26,538,28-41,889,66) |
Table 5 also shows the mean annual medical cost per patient itemized by type of health care resource, where statistically significant differences were seen in the mean annual medical cost per patient associated with visits and hospital admissions between stage I vs stage IV patients (P<.0001) and stage II vs stage IV patients (P=.016). These differences were also seen in lab testing spending among stage I vs stage IV patients (P<.0001), stage I vs stage III patients (P=.046), and stage II vs stage IV patients (P=.013).
Similarly, regarding imaging tests, differences were seen between stage I vs stage IV patients (P<.0001). However, no differences were seen associated with non-pharmacological treatments.
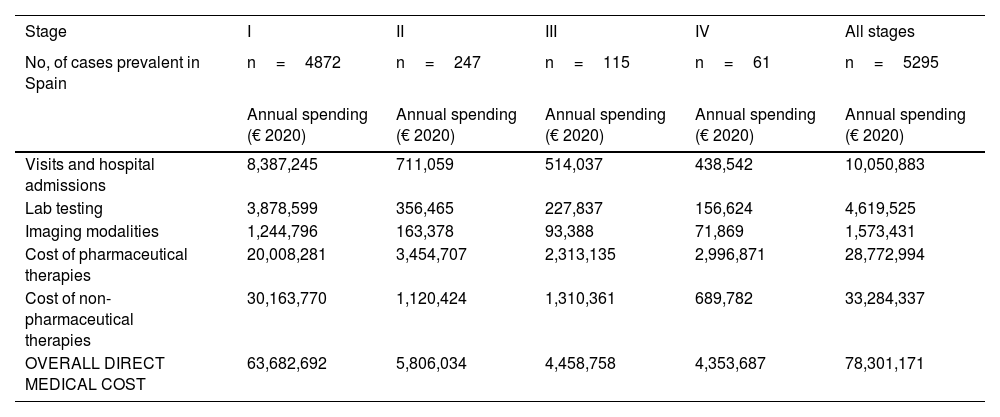
To calculate the financial burden of the disease from the perspective of the SNS, the prevalence by stage was estimated as described in international data,7 as currently, there is no prevalence data on the stage of MF/SS in Spain.
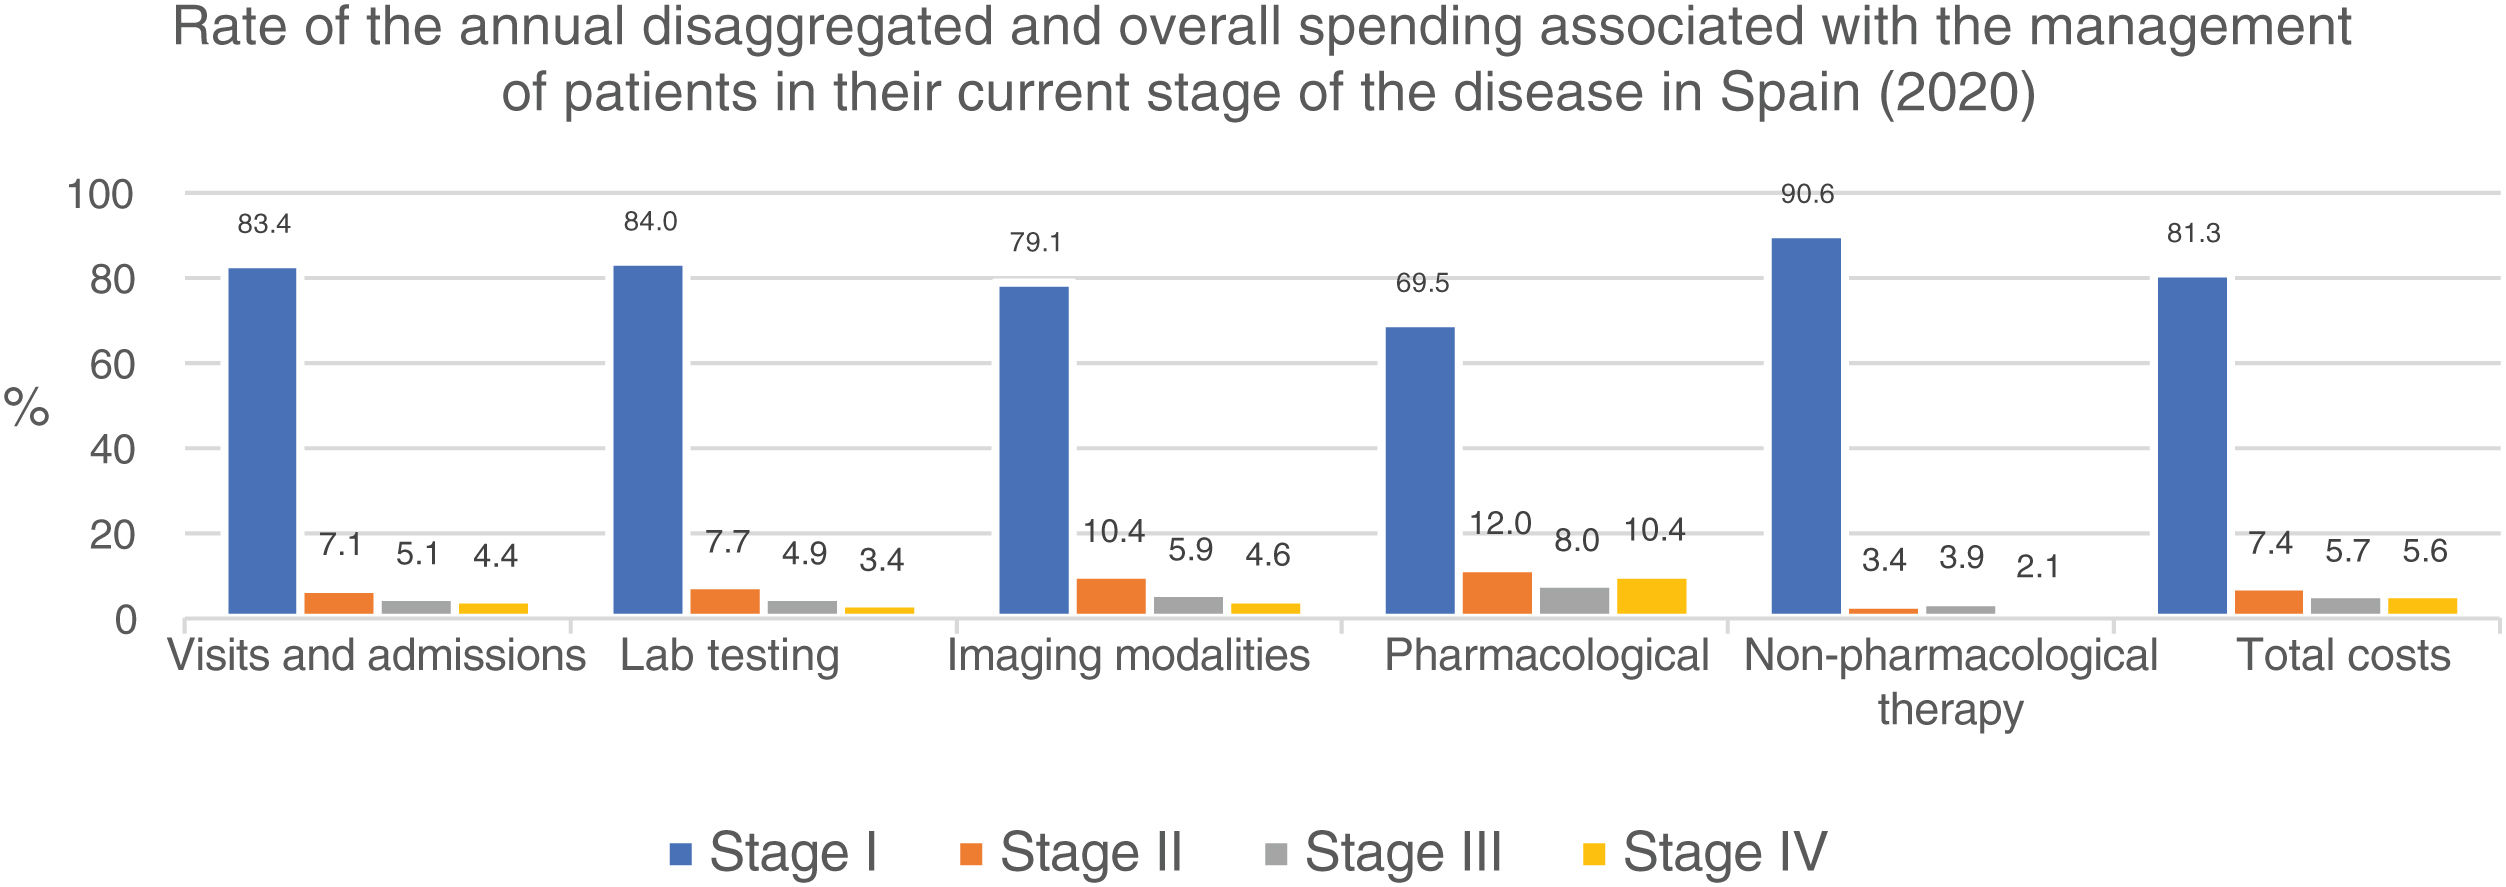
Similarly, table 6 shows the results of the overall annual direct medical cost of all patients with MF/SS, in Spain, based on the stage of the disease and itemized by type of resource. The estimated overall annual spending was €78,301,171, 81.3% of which was attributed to stage I patients, 7.4% to stage II patients, 5.7% to stage III patients, and 5.6% to stage IV patients. Figure 2 shows the overall annual spending for each type of resource allocated to patients per stage. In stage I and stage IV, the highest spending was associated with non-pharmacological and pharmacological treatments, respectively.
Overall annual direct medical cost associated with disease stage itemized by type of health care resource and pharmacological and non-pharmacological therapy used.
| Stage | I | II | III | IV | All stages |
|---|---|---|---|---|---|
| No, of cases prevalent in Spain | n=4872 | n=247 | n=115 | n=61 | n=5295 |
| Annual spending (€ 2020) | Annual spending (€ 2020) | Annual spending (€ 2020) | Annual spending (€ 2020) | Annual spending (€ 2020) | |
| Visits and hospital admissions | 8,387,245 | 711,059 | 514,037 | 438,542 | 10,050,883 |
| Lab testing | 3,878,599 | 356,465 | 227,837 | 156,624 | 4,619,525 |
| Imaging modalities | 1,244,796 | 163,378 | 93,388 | 71,869 | 1,573,431 |
| Cost of pharmaceutical therapies | 20,008,281 | 3,454,707 | 2,313,135 | 2,996,871 | 28,772,994 |
| Cost of non-pharmaceutical therapies | 30,163,770 | 1,120,424 | 1,310,361 | 689,782 | 33,284,337 |
| OVERALL DIRECT MEDICAL COST | 63,682,692 | 5,806,034 | 4,458,758 | 4,353,687 | 78,301,171 |

The multivariate analysis showed a statistically significant association between the annual direct medical cost per patient and age (P<.0001), with lower costs being associated with an older age. The patients’ stage at the present time (I vs II [P<.0001], I vs III [P=.009], I vs IV [P<.0001]) also made a statistically significant impact on spending, with higher stages being associated with higher costs.
DiscussionDue to the intrinsic difficulties of rare disease research, conducting studies on disease spending, especially with new treatments, is necessary to properly understand the socioeconomic dimension of the problem.
In our study, we found that the mean annual direct medical cost per patient with MF/SS was €34,214. These results were similar to the mean annual direct medical cost per patient in metastatic stages of the most common types of cancers in Spain and notably higher than the medical cost of cancers in localized stages. First, metastatic colorectal cancer was associated with a mean annual spending of €34,738, followed by metastatic breast cancer (€35,732), and lung cancer (€34,272).26 However, the medical spending per patient with MF/SS was lower compared to patients with hematological cancer in both local and metastatic stages of the disease (at €55,578 in both cases).
With an estimated annual incidence rate of 260 patients with MF/SS, we estimated that there was a total of 5295 patients in Spain back in 2020. The overall annual direct medical cost associated with the follow-up and treatment of patients with MF/SS was €78,301,171, 81% of which was attributed to stage I patients (table 6; fig. 2). Assuming that all stage IV patients are equivalent to patients with SS, the medical cost per disease can be estimated for a mean annual spending per patient with SS (€71,317) much higher than that of MF (€25,116).
Our study confirmed a higher annual direct medical cost in advanced stages of the disease, but a lower spending associated with patients who were older or with a better quality of life (data not shown).
Information on spending associated with CTCL is limited (only 3 studies have been found in the medical literature to this date).
The American Academy of Dermatology (AAD) analyzed the spending associated with 24 dermatological conditions reported back in 2013.27,28 They estimated a mean annual spending per patient of $3,182.60 in U.S. patients, resulting in an overall annual spending of $180 million associated with the management of 56 243 patients.27,28 In our study, we saw an amount 10.8 times higher per patient, maybe because the AAD did not include non-pharmacological treatment costs added to the difference in the number of necessary visits.
In a second study, Semenov et al.29 estimated the spending associated with the management of the disease based on the patients’ quality of life results (a loss of 1.48 QALYs per patient). Considering $50 000 per QALY, the cost of the disease was estimated at $73,889.29 In our study, we also saw a significant association between spending and quality of life, with a loss of quality of life similar to the deterioration seen in other cancer patients.
Finally, in a third study conducted in Spain, the spending of therapies administered in the initial stages of the disease ranged from €7,426.42 to €10,046.58 over a 6-month period. In our study, we estimated an annual spending of €11,952.47 and €23,506.21 for stage I and II patients, respectively, which is consistent with data from the Spanish study (table 5).22
In our study, over 80% of disease spending is attributed to stage I patients (table 6; fig. 2) because, although their mean spending is lower (table 5), they represent the largest group. Also, since the estimated median survival of patients with MF/SS is 18.3 years—much higher in stage I patients—the financial impact of disease spending across life is higher.
Cancer spending in Spain from a social perspective was estimated at €5,458 million in 2015 (€4,818 million in direct medical costs [88.3%] and €640 million in indirect spending [11.7%]).30 Overall, it has been estimated that 55% of cancer spending is paid by the SNS, and 45% by families and patients alike.26 In our study, this would mean that each patient with MF/SS bears an annual cost of €27 993 in Spain; however, there are no data available to confirm this indirect spending in the management of MF/SS, which means that additional studies are more than welcome on this regard.
Our study has several limitations. The first was excluding indirect spending, thus underestimating the true spending associated with the management of the disease. Additionally, retrospective studies have limitations per se, in this case, unrecorded spending that may have underestimated the true value of CTCL.
Finally, we should mention that the study was conducted in 2020, a year globally impacted by the SARS-CoV-2 pandemic, which limited medical visits. The annual data recorded in the study go from May 2019 through January 2021.
ConclusionsThe annual direct spending of CTCL in Spain was €78,301,171, with a mean annual direct medical cost per patient of €34,214.97. The highest spending for the SNS is seen in the early stages of the disease due to the higher number of patients in stages I/II vs stages III/IV. The mean annual spending per patient goes up as the stage of the disease advances (up to 6 times higher in stage IV vs stage I). Non-pharmacological treatments are the health care resource that contributes the most to the overall direct medical costs associated with the management of the disease, followed by pharmacological treatments, and to a lesser extent, hospital visits and admissions. In future studies, spending associated with the management of patients and indirect spending due to productivity loss should be considered to describe the true social impact of the disease.
FundingThe study was entirely funded by Kyowa Kirin Farmacéutica, S.L.
Conflicts of InterestDr. Pablo Luis Ortiz Romero, and Dr. Belén Navarro Matilla received fees for coordinating the study. Pablo Viguera and Julia Blanco are employees of Kyowa Kirin Farmacéutica, S.L. The remaining authors declared no conflicts of interest whatsoever.
We wish to express our deepest gratitude to the patients who generously accepted to participate in the study, as well as for their selfless collaboration.
The project was developed within the framework of the Master of Health Economics and Pharmaceuticals program offered by UPF Barcelona School of Management, Barcelona, Spain an institution affiliated with Universidad Pompeu Fabra, Barcelona, Spain.