


Meta-analysis offers a way to assess the clinical efficacy of a treatment by combining the results of randomized clinical trials while maintaining randomization; the combined effects, with their confidence intervals, can be represented with a forest plot. The efficacy of several different treatment options can be assessed with either direct or indirect comparisons. Indirect comparisons may be placebo-anchored as well as network meta-analyses (NMA) that use either a frequentist or Bayesian approach, depending on the statistical framework and the definition of probability selected. Indirect comparisons may also adjust for covariates or utilize individual participant data. Bayesian NMA are able to establish a rank order of efficacy based on probabilities or credibility intervals, which can be described by the surface under the cumulative ranking curve (SUCRA). Statistical superiority is demonstrated by pairwise comparisons, which are generally presented in league tables. This review provides clinical practitioners with detailed descriptions of these methods, drawing on examples from recently published NMA that rank the relative efficacy of biologic treatments for moderate to severe psoriasis. According to NMA findings, the four most effective treatments in both the short term (10-16 weeks) and the long term (approximately one year) are, in rank order, risankizumab (first in all studies that include it), brodalumab, guselkumab, and ixekizumab. However, the between-treatment differences are not always significant.
El metaanálisis (MA) permite evaluar la eficacia clínica de un tratamiento al agregar los resultados de varios ensayos clínicos (RCT) preservando la aleatorización; los efectos agregados (con sus intervalos de confianza) pueden representarse mediante un diagrama de «bosque». Para comparar la eficacia de diversas opciones terapéuticas se pueden utilizar comparaciones directas o indirectas. Estas últimas incluyen comparaciones indirectas de tratamientos ancladas a placebo, MA en red (NMA) (que a su vez pueden ser frecuentistas o bayesianos, dependiendo del marco estadístico y la definición de probabilidad elegida), comparaciones indirectas de tratamientos ajustadas según covariables, y comparaciones indirectas con datos individuales. Los NMA bayesianos permiten establecer un orden de eficacia basado en probabilidades o intervalos de credibilidad, que pueden describirse con el área bajo la curva de probabilidad de rango acumulativa (SUCRA), y la superioridad estadística se demuestra mediante comparaciones a pares, que generalmente se presentan en forma de tablas de liga. La presente revisión, orientada a un lector clínico, describe estos aspectos metodológicos con detalle empleando como ejemplo las recientes publicaciones de NMA que permiten establecer la eficacia relativa de los tratamientos biológicos de la psoriasis moderada a grave. Sobre la base de distintos NMA, los cuatro tratamientos más eficaces tanto a corto (10-16 semanas de tratamiento) como a largo plazo (aproximadamente un año) son risankizumab (número uno de orden en todos los estudios que lo incluyen), seguido de brodalumab, guselkumab e ixekizumab, aunque las diferencias entre ellos no siempre resultan significativas.
The introduction of biologic agents more than 15 years ago marked the start of enormous progress in therapies for management of psoriasis. Adalimumab and ustekinumab were the first biologic agents administered subcutaneously that surpassed a satisfactory efficacy threshold difference in PASI 75 response rate with respect to placebo greater than 50% (corresponding to a number of patients needed to treat [NNT] < 2).1 Although one of the randomized clinical trials (RCTs) of adalimumab included an active treatment arm with methotrexate (and subsequently, a comparative study of infliximab with methotrexate was published), the first RCT comparing 2 biologic agents (ustekinumab versus etanercept) was published in 2010.2
In 2015, secukinumab was granted marketing authorization; this was the first of a new class of antibodies targeting interleukin 17 (IL-17A). The basic characteristic of anti-IL17A agents is their rapid onset of therapeutic action and having made PASI 90 response the standard benchmark of efficacy, with a difference in response rates compared with placebo in excess of 70%.3 The clinical development programs of these agents have included RCTs with etanercept, adalimumab, and ustekinumab, in addition to placebo, and recently, guselkumab was included as an active comparator in a couple of RCTs.
Guselkumab, approved by the European Medicines Agency (EMA) at the end of 2017, is the first representative of a class of biologic agents that specifically block the p19 subunit of IL-23; other agents in this class include tildrakizumab and risankizumab. The corresponding comparative studies also included etanercept, adalimumab, ustekinumab, and secukinumab, depending on which agent was the most relevant comparator at the time when the trials were designed.
Efficacy and Safety ComparisonsDermatologists face a difficult choice with a wide range of options, and pivotal RCTs supporting the authorizing agencies' approval do not enable an assessment of relative efficacy (or safety) compared with other therapeutic agents. Other factors may influence outcomes to a greater or lesser extent (depending on the drug), such as previous failure of a biologic agent, body weight, and comorbidities, particularly psoriatic arthritis. On the other hand, neither the populations nor baseline situation (with washout period and PASI scores above 12) used in RCTs adequately represent clinical reality. In any case, we need a means to compare efficacy data from different drugs, given that a cost-effectiveness analysis, taking into account pricing at a given time, is an essential component of any therapeutic algorithm.
First, a systematic review should be conducted according to a well-established methodology,4 to identify published RCTs of the disease in question (in our case, plaque psoriasis). When several RCTs of the same drug are available, the results should be combined using methods that maintain the randomization of each RCT; for these purposes the meta-analysis (MA) methodology was developed. MAs can provide more precise results, but they can also generate errors if differences in design between studies and publication bias are not taken into account.
In the case of psoriasis, the methodology of the studies and the selection criteria in general are very uniform, and this is an advantage although the possibility of study heterogeneity should always be considered. In many cases, the data/outcomes of interest are dichotomous (for example, PASI 90 response: yes/no) and the discussion here will focus on such data, although there are MA methods that can be applied to continuous data/outcomes, ordinal outcomes or combinations thereof. Finally, sensitivity analyses should be employed (changing the conditions determining which RCTs to include) to confirm that the findings are robust and can thus be used to guide therapeutic or reimbursement decisions.
With a pairwise MA, data from several RCTs of drug A compared with placebo (or drug B) can be combined; on combining different studies, it may be possible to detect a significant difference that would otherwise not be apparent because the individual RCTs are underpowered.
In MAs, a statistical parameter representative of the intervention effect (treatment) is calculated for each of the studies; for dichotomic variables, the odds ratio (OR), the risk ratio (RR), or the risk difference (probability or percentage of response) between the drug and its comparator (usually placebo) are used. For example, if a drug can achieve a PASI 90 response in 633 of 1000 patients (63.3%), compared with 25 of 950 (2.6%) for placebo, the OR is (633×925)/(25×367)=63.8; the RR is (633×950)/(25×1000)=36.1; the risk difference (63.3-2.6)=60.7% (or 0.67), and 3 patients need to be treated to achieve a PASI 90 response in 2 (NNT=1/0.67=1.5). OR and RR are relative measures, whereas the risk difference and NNT are absolute measures; in general, the relative measures are more consistent among studies and do not have numerical limits (a probability cannot be negative). In general, clinicians tend to overestimate the treatment effect when expressed as an OR, although the differences between OR and RR are small for uncommon events (with a probability of approximately < 20%). This is not the case for treatment response in RCTs of psoriasis.
Essentially, there are 2 types of statistical model for MAs, depending on whether each RCT is considered to measure an unchanging drug effect or whether the effects in each RCT follow a random distribution.5
- •
The fixed-effects model assumes that there is no variation in the relative treatment effect between different RCTs, and that the differences observed are due only to chance. In this case the aim is to calculate the true treatment effect. In general, the Mantel-Haenszel statistical method is used, particularly for small sample sizes, but the inverse variance method and the Peto method can also be used. These methods are more powerful and less biased when there are studies without events (for example, mortality), the intervention effect is small (probability <1%), and the size of the treatment arms is balanced.
- •
The random-effects method assumes that the treatment effect can vary from one RCT to another (the outcome of each RCT would follow a normal distribution) and the combined effect would be the mean of a normal distribution whose standard deviation would reflect heterogeneity. In the case of the random-effects model, the DerSimonian-Laird method is generally used.
The effect measure for any of these methods can be OR, RR, or risk difference, except when the Peto method is used, in which case only ORs can be combined. The effect of each RCT is represented in an effects diagram or forest plot, by means of blocks with horizontal lines that indicate the confidence interval (CI), generally at a level of 95%. The size of each block often represents the weight assigned to each study in the MA. A common way to weigh RCTs is according to the reciprocal of the variance or square of the standard error: large studies are given more weight because their standard error is smaller. The summary effect, or weighted mean of the effects of each intervention, is represented by a diamond (with a height proportional to the number of subjects enrolled in the RCT) (Fig. 1).6
 were estimated using the Mantel-Haenszel ((M-H)) method and different measures of heterogeneity have been calculated. Modified from Cameron et al.6")
Example of forest plots corresponding to 2 pairwise random-effects MAs; the effects (RR for PASI 90 response) were estimated using the Mantel-Haenszel ((M-H)) method and different measures of heterogeneity have been calculated.
Modified from Cameron et al.6
There are different measures of heterogenicity (due to differences in the characteristics of the populations in each study [clinical diversity], study design, outcome measures of interest, and bias [methodological diversity]) between the different RCTs included in an MA; for example, the Cochran Q test (χ2) with its corresponding P value, or I2 with its corresponding CI, which is used in Cochrane reviews. I2 is calculated from the Cochrane Q value as 100% × (Q – degrees of freedom)/Q, and it describes the percentage variability in the effect estimates due to heterogeneity, plus the random sampling error. Negative values are considered as 0% and indicate that heterogeneity is not observed; values below 25% indicate that the RCTs have low heterogeneity; values above 50% indicate high heterogeneity. Another measure of heterogeneity that is used for random-effects MAs is τ2.
The heterogeneity among different RCTs can be due to treatment interactions with different covariates (baseline values of weight, age, comorbidities, placebo effect, etc) that determine bias.7 Covariates can also be interdependent; for example, weight may modify the response not only of treatment but also of placebo.8 There are statistical measures of the extent of bias and metaregression models that take into account these interactions, although it is preferable to use indirect comparisons with individual data (see below).
Pairwise MAs provide a pooled estimate of a treatment effect compared with placebo, and the 95% CI indicates that the real or average value of the effect lies within the interval with 95% probability, but it does not enable rigorous comparison of the relative effect of 2 treatments, particularly when CIs overlap.9
The relative efficacy of different treatments or therapeutic interventions can be assessed with comparative RCTs (direct comparisons), MAs with multiple RCTs (indirect comparisons), and patient registry data.
Head-to-head (H2H) comparative RCTs require random assignment to treatment and double-blind assessment of efficacy, but even if the inclusion criteria are identical and the treatment arms are largely balanced, biases may still be present. For example, even assuming that there are no meaningful changes in the potency of the molecule over time, the absence of a placebo arm can increase therapeutic response compared with pivotal RCTs, as observed in some equivalence trials.10 The choice and timing of the endpoint assessment to determine the outcome of an RCT will often favor the sponsor’s desired outcome.11,12 When there are differences between cutaneous response and articular response between 2 drugs, the choice of a composite outcome measure can also favor one of the drugs.13
Even when H2H RCTs are available, both clinicians and drug evaluation agencies are placing increasing importance on the different methods of indirect comparison between treatments, particularly when multiple options are available. By combining direct and indirect comparisons, we can obtain a more refined estimate of the relative value of each drug, provided these comparisons meet certain conditions discussed later.14
The different methods available for indirect comparisons of treatments include15:
- •
Adjusted or anchored indirect treatment comparisons (ITCs), comparing aggregate data from RCTs of drug A with aggregate data from the corresponding placebo arm or another drug B which has been compared with placebo.
- •
Network MA (NMAs), comparing aggregate data from different drugs with placebo (and between them if H2H RCTs are available), with or without adjustment for baseline characteristics and in particular different placebo responses.
- •
Indirect comparisons with individual data on a treatment adjusted for the aggregate characteristics of others (matching-adjusted indirect comparisons, or MAIC), weighting individual patient data such that they become equivalent to RCTs for which only aggregate data are available.16–19 There are other methods for indirect comparison with data from individual patients, and recommendations have been published with a view to their use both in approval processes and reimbursement evaluations.20
- •
Indirect comparisons with individual data for each treatment arm (individual patient-level data, or IPD).
Randomization in RCTs enables the treatment effect to be separated from other factors and ensures baseline risk is balanced across treatment arms, even in RCTs performed over different periods. To maintain the effect of randomization in multiple comparisons, Bucher et al.21 introduced the ITC method, using OR as the effect measure, although this is only applicable to indirect comparisons of treatments that have been compared with another common comparator.15 Subsequently, Lumley et al.22 developed a technique (NMA) to compare 2 treatments via more than 1 common comparator, including a measure of the possible inconsistency or discrepancy in results; the approach was subsequently further developed.23,24 Finally, Lu and Ades25 incorporated direct comparisons (H2H RCTs) in a more sophisticated method denoted mixed treatment comparisons (MTCs), which enables different treatments to be ranked according to the probability that they are better or worse.
Indirect treatment comparisons require the clinical RCTs to be linked to form a network, whether with open or closed loops, if they include H2H RCTs (direct evidence, as well as indirect evidence) (Fig. 2). When we have H2H RCTs for some treatments, or even RCTs with common treatment arms in addition to placebo, NMAs are used to obtain estimates of the relative effect of different treatments with greater precision than pairwise MA and rank them coherently, taking into account possible inconsistencies between the results of direct and indirect comparisons.
 and their diagrams. In the broadest sense, all indirect comparisons are NMAs, unlike traditional MA, which do not simultaneously compare several treatments but rather pool different RCTs comparing 2 interventions, for example, treatment versus placebo. Bucher21 introduced ITCs to indirectly compare 2 treatments that have been compared directly with placebo in different RCTs. Lumley et al.22 developed NMAs in the strict sense of the term to compare 2 treatments via more than 1 common comparator. Lu and Ades25 introduced the method of MTCs, which include both indirect comparisons and direct comparisons by means of H2H RCTs (closed loops) and enable a probable efficacy ranking of different treatments to be established.")
Classification and nomenclature of indirect comparisons of interventions (treatments) and their diagrams. In the broadest sense, all indirect comparisons are NMAs, unlike traditional MA, which do not simultaneously compare several treatments but rather pool different RCTs comparing 2 interventions, for example, treatment versus placebo. Bucher21 introduced ITCs to indirectly compare 2 treatments that have been compared directly with placebo in different RCTs. Lumley et al.22 developed NMAs in the strict sense of the term to compare 2 treatments via more than 1 common comparator. Lu and Ades25 introduced the method of MTCs, which include both indirect comparisons and direct comparisons by means of H2H RCTs (closed loops) and enable a probable efficacy ranking of different treatments to be established.
There are different guidelines for publishing RCTs, MAs, and NMAs; PRISMA is the most relevant in the latter case.26 In NMAs, it is essential to provide information on the network structure, and to help with this task, there are specific programs that produce diagrams in which the size of the circles is proportional to the number of patients randomized to each treatment (or placebo) and the width of the lines is proportional to the number of studies included in each comparison (Fig. 3).27

Example of an NMA network diagram for PASI 90 results at 12 or 16 weeks of biologic treatment for psoriasis.27 The size of the nodes represents the sample size of the interventions and the widths of the lines the number of studies included.
Abbreviations: ADA, adalimumab; APR, apremilast; BIW, twice weekly, BRO, brodalumab; ENT, etanercept; GUS, guselkumab; IFX, infliximab; IXE, ixekizumab; PBO, placebo; QW, once a week; Q2W, every 2 weeks; SEC, secukinumab; UST, ustekinumab.
Modified from Cameron et al.6
NMAs can be performed within a frequentist or Bayesian framework.28
In the former, the result of the NMA is expressed as a point estimate of the relative efficacy of each treatment compared with the others, with a 95% CI; if the NMAs were repeated, the real value of the effect would lie within the CI 95% of the time; this does not mean that the probability of the real value lying within the CI is 95%.
The Bayesian approach implies a subsequent distribution of probabilities based on the results of NMAs, which enables the different treatments to be ranked according to their relative efficacy,29 thereby facilitating pharmacoeconomic decision making. When treatment effects are evaluated, it is generally assumed that the probability a priori is not informative, although previous NMA data can be incorporated.30 Bayesian NMAs require extensive calculations with statistical packages that can run Markov Chain Monte Carlo (MCMC) simulations. When significant heterogeneity is present among the RCTs included in the NMA, it is recommended to adjust for baseline risk (for example, placebo effect) taking into account multiple covariates, whether observed or not, and these are used to optimize the model.6 The equivalents of CIs for the relative effects of the different pairwise comparisons in the league tables are denoted by credibility intervals (CrIs) in the Bayesian framework.
The results of NMAs allow comparison of effects (efficacy for example) for each treatment relative to another. The results are generally presented in the form of league tables (Fig. 4).31
 is the RR of the treatment defined by the column with respect to that defined by the row; if the 95% CI does not include 1, RR>1 favors the treatment defined in the column, RR<1 favors treatment defined in the row. Extracted from Cameron et al.6")
Example of league table for a frequentist random-effects NMA showing RR outcomes for PASI 90 response adjusted for baseline risk. The treatments are ordered left to right by decreasing SUCRA rank. The effect estimate (efficacy) is the RR of the treatment defined by the column with respect to that defined by the row; if the 95% CI does not include 1, RR>1 favors the treatment defined in the column, RR<1 favors treatment defined in the row.
Extracted from Cameron et al.6
The ranking of the different treatments is based on calculation of surface under the cumulative ranking curve (SUCRA) (Fig. 5),27 which is expressed as a percentage and can be interpreted as the probability that all the other treatments are inferior.32 The estimated ranking for each drug in the NMA can also be represented with their corresponding 95% CrI in the so-called ranking plots. Although the SUCRA approach was developed in a Bayesian framework, some programs allow SUCRA calculations in frequentist NMAs; recently, an index has been proposed (P-score)33 which allows a similar ranking to be established in the frequentist framework.
![Illustration of SUCRA values.27 The ranking plot (not represented) would give the probability of the rank order, that is, that each treatment was the best, second, third, etc., following a normal distribution or another type of distribution. SUCRA is the surface under the cumulative ranking curve. The horizontal axis represents the possible rank for each treatment (from being the best [1] to the worst [14 in this case] from left to right). On the vertical axis, the cumulative probability that each treatment is the best option, the first or second best option, one of the best 3 options, etc. If a treatment has 100% probability of being the best, the y value will be 1 (100%) and the curve will be a horizontal line (100% SUCRA); the curve for a treatment (for example, placebo) that had 100% probability of being the worst would be represented by a horizontal line to the last position where it would increase to 1 (SUCRA 0%). The intermediate SUCRA values can be considered as the percentage of area under curve compared to the rectangle that represents 100%, and enable different treatments to be ranked. Another way of interpreting SUCRA for a given treatment is as the probability (expressed as a percentage) that the other treatments are worse. A, brodalumab 140mg; B, brodalumab 210mg; C, guselkumab 100mg; D, guselkumab 50mg; E, ixekizumab 80mg Q2W; F, ixekizumab 80mg Q4W; G, placebo; H, risankizumab 150mg; I, secukinumab 150mg; J, secukinumab 300mg; K, tildrakizumab 100mg; L, tildrakizumab 200mg; M, ustekinumab 45mg; and N, ustekinumab 90mg.](https://static.elsevier.es/multimedia/15782190/0000011200000003/v1_202103020923/S1578219021000123/v1_202103020923/en/main.assets/gr5.jpeg?xkr=ue/ImdikoIMrsJoerZ+w91sAmkCw32Jed9sZf6jzEuDbFpW7G0NfARZs8afh+9K8v8RN+oFy2ZmalFHXVYo6AhW1X2fPZIKK3IIK6Exes3FIAY9jkAo5mMJHNfUKbUjVXr7LSW92KM5X61nd3f5g1YU49UPcg+3IvDW9Y0AGFppopSiShfm04KJIZ4CVbg8AH4wyTxGdiNMOl7IYijJc4ozlLxVhIoIp7y3Q08gchxCHwitnj++g9ZxHaoMmBOAUIIMhOj0TyY2wC/0wDyJmV7saWMLUcjIIpELWc3sVP1c= "Illustration of SUCRA values.27 The ranking plot (not represented) would give the probability of the rank order, that is, that each treatment was the best, second, third, etc., following a normal distribution or another type of distribution. SUCRA is the surface under the cumulative ranking curve. The horizontal axis represents the possible rank for each treatment (from being the best [1] to the worst [14 in this case] from left to right). On the vertical axis, the cumulative probability that each treatment is the best option, the first or second best option, one of the best 3 options, etc. If a treatment has 100% probability of being the best, the y value will be 1 (100%) and the curve will be a horizontal line (100% SUCRA); the curve for a treatment (for example, placebo) that had 100% probability of being the worst would be represented by a horizontal line to the last position where it would increase to 1 (SUCRA 0%). The intermediate SUCRA values can be considered as the percentage of area under curve compared to the rectangle that represents 100%, and enable different treatments to be ranked. Another way of interpreting SUCRA for a given treatment is as the probability (expressed as a percentage) that the other treatments are worse. A, brodalumab 140mg; B, brodalumab 210mg; C, guselkumab 100mg; D, guselkumab 50mg; E, ixekizumab 80mg Q2W; F, ixekizumab 80mg Q4W; G, placebo; H, risankizumab 150mg; I, secukinumab 150mg; J, secukinumab 300mg; K, tildrakizumab 100mg; L, tildrakizumab 200mg; M, ustekinumab 45mg; and N, ustekinumab 90mg.")
Illustration of SUCRA values.27 The ranking plot (not represented) would give the probability of the rank order, that is, that each treatment was the best, second, third, etc., following a normal distribution or another type of distribution. SUCRA is the surface under the cumulative ranking curve. The horizontal axis represents the possible rank for each treatment (from being the best [1] to the worst [14 in this case] from left to right). On the vertical axis, the cumulative probability that each treatment is the best option, the first or second best option, one of the best 3 options, etc. If a treatment has 100% probability of being the best, the y value will be 1 (100%) and the curve will be a horizontal line (100% SUCRA); the curve for a treatment (for example, placebo) that had 100% probability of being the worst would be represented by a horizontal line to the last position where it would increase to 1 (SUCRA 0%). The intermediate SUCRA values can be considered as the percentage of area under curve compared to the rectangle that represents 100%, and enable different treatments to be ranked. Another way of interpreting SUCRA for a given treatment is as the probability (expressed as a percentage) that the other treatments are worse.
A, brodalumab 140mg; B, brodalumab 210mg; C, guselkumab 100mg; D, guselkumab 50mg; E, ixekizumab 80mg Q2W; F, ixekizumab 80mg Q4W; G, placebo; H, risankizumab 150mg; I, secukinumab 150mg; J, secukinumab 300mg; K, tildrakizumab 100mg; L, tildrakizumab 200mg; M, ustekinumab 45mg; and N, ustekinumab 90mg.
Both ITCs and NMAs use aggregate data, as provided in the publications, in a systematic fashion, following the guidelines of CONSORT and SPIRIT.26 When patient-level data for one of the treatments and placebo in several RCTs are available, an indirect MAIC-type comparison can be performed, and when individual data are available for several treatment arms, an IPD analysis can be performed.
Recent Examples of Indirect Comparisons of Psoriasis TreatmentsNetwork Meta-analyses (NMAs)In most psoriasis NMAs, response data from several RCTs are compared at the end of the assessment period with placebo.
In a detailed frequentist NMA with 14 treatments and doses, including placebo, although with only 28 studies,27 the SUCRA and mean ranges corresponding to PASI 100 response rates of approved treatments were as follows: brodalumab 210mg 85.0%, 2.9; ixekizumab 80mg Q2W 83.3%, 3.2; risankizumab 150mg 71.3%, 4.7; guselkumab 100mg 61.4%, 6; secukinumab 300mg 62.4%, 5.9; ustekinumab 90mg 34.5%, 9.5; ustekinumab 45mg 33.1%, 9.7; tildrakizumab 100mg 21.9%, 11.2.
A systematic review and Bayesian NMA included the biologic agents most recently approved by the European Medicines Agency (EMA) for the treatment of psoriasis and focused on PASI 50, PASI 75, PASI 90, and PASI 100 response at 10 to 16 weeks.34 The analysis only considered RCTs with doses approved by the EMA and US Food and Drug Administration (FDA). Adjustment for placebo response (determinant of RCT heterogeneity) in the NMA improved the goodness of fit of the model. The publication included difference in response and RR relative to placebo, RR relative to the 6 most recently approved drugs, and NNT. The NNTs for PASI 100 response were below 3 in 4 of the treatments compared: ixekizumab (2.49; 95% CrI 1.66-4.43), risankizumab (2.55; 95% CrI 1.69-4.62), brodalumab (2.60; 95% CrI 1.17-4.72), and guselkumab (2.90; 95% CrI 1.83-5.52). For reference, the NNT for PASI 100 response calculated for adalimumab and ustekinumab was approximately 6.
A recent review by the Cochrane group,35 with a classic MA and a frequentist NMA, included 113 references corresponding to 19 different treatments for moderate to severe plaque psoriasis, including small molecules, regardless of whether the dose used in the study was finally approved by the EMA. The main outcome measure was the percentage of patients with PASI 90 response (not PASI 100) and the percentage of patients with serious adverse events (SAEs) at the end of the induction phase (8-24 weeks). The NMA method used was multivariate regression using Stata software.
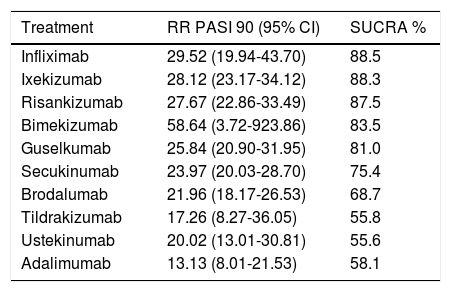
The ranking according to SUCRA obtained in this non-Bayesian NMA is shown in Table 1. The authors of this NMA combined the results for efficacy (RR for achieving PASI 90 response compared with placebo) and acceptability (inverted RR values for SAEs compared with placebo) in a 2-dimensional plot, like the one used by the same authors36 and other authors37; risankizumab and bimekizumab (with a single RCT) were located in the upper right corner, where the optimal treatments are located. This NMA includes 6 sensitivity analyses selecting studies included according to additional parameters such as number of participants, risk of bias, dose used, and time of assessment of induction response.
Ranking by RR (95% CI) Compared With Placebo of PASI 90 and SUCRA, Based on the Frequentist Random-Effects NMA of Sbidian et al.35
| Treatment | RR PASI 90 (95% CI) | SUCRA % |
|---|---|---|
| Infliximab | 29.52 (19.94-43.70) | 88.5 |
| Ixekizumab | 28.12 (23.17-34.12) | 88.3 |
| Risankizumab | 27.67 (22.86-33.49) | 87.5 |
| Bimekizumab | 58.64 (3.72-923.86) | 83.5 |
| Guselkumab | 25.84 (20.90-31.95) | 81.0 |
| Secukinumab | 23.97 (20.03-28.70) | 75.4 |
| Brodalumab | 21.96 (18.17-26.53) | 68.7 |
| Tildrakizumab | 17.26 (8.27-36.05) | 55.8 |
| Ustekinumab | 20.02 (13.01-30.81) | 55.6 |
| Adalimumab | 13.13 (8.01-21.53) | 58.1 |
A Bayesian NMA underlies the 2020 rapid update to the British Association of Dermatology guidelines for the treatment of psoriasis with biologic agents.38 All data used in this NMA correspond to those published in the RCTs at 3-4 months of treatment; the percentage of responders with complete or almost complete clearance, change in Dermatology Life Quality Index (DLQI), and treatment discontinuations due to adverse events were assessed, and a sensitivity analysis was performed with the doses approved by the EMA. In the case of complete or almost complete clearance, at the approved doses, the available drugs were ranked as follows according to SUCRA and the mean rank: risankizumab (89.9%; 2.2); ixekizumab (87.8%; 2.5); guselkumab (80.2%; 3.4); brodalumab (74.4%; 4.1); infliximab (73.5%; 4.2); secukinumab (68.8%; 4.7); adalimumab (41.1%; 8.1); ustekinumab (40.0%; 8.2); tildrakizumab (37.4%; 8.5); certolizumab pegol 200mg (30.6%; 9.3); methotrexate (14.1%; 11.3); etanercept (12.3%; 11.5), and placebo (0%; 13).
There Are Fewer Publications With Long-term NMA Outcomes (After Approximately 1 Year)A frequentist NMA of the efficacy of different treatments at 52 weeks published in 201939 included results for RR, relative OR, and SUCRA (the first in the ranking of overall efficacy was brodalumab, with 97%, followed by ixekizumab with 83%); however, this NMA did not include clinical trials of either risankizumab or guselkumab.
A recent study updated this approach with a Bayesian NMA, collecting efficacy data (PASI 75, PASI 90, PASI 100 response rates) up to week 48-52 from 28 RCTs, of which 9 had H2H comparisons up to the end of the maintenance phase (primary analysis); the other RCTs were included in another analysis assuming that the responses compared with placebo at the end of induction (double-blind comparison with placebo) were sustained during maintenance (secondary analysis).
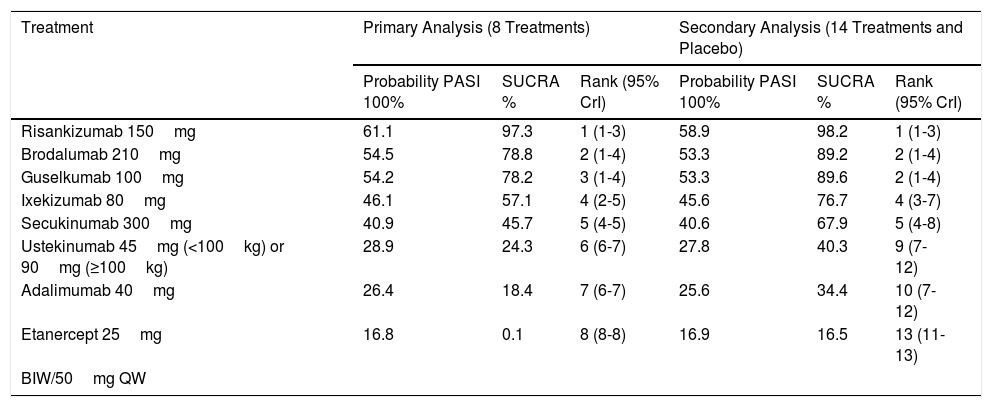
The primary analysis showed that risankizumab is significantly superior to the other treatments (except brodalumab and guselkumab) at all levels of PASI response; that brodalumab and guselkumab are superior to the other treatments except ixekizumab; and that ixekizumab and secukinumab are superior to ustekinumab and adalimumab, with etanercept being the least effective treatment. The estimated NNT for PASI 100, with ustekinumab as reference, was 4 for risankizumab, 5 for brodalumab and guselkumab, 7 for ixekizumab, and 9 for secukinumab. The probabilities for PASI 100 response, SUCRA, and median ranks with 95% CrI are shown in Table 2. The secondary analysis, including 14 treatments and placebo, yielded results consistent with the primary analysis (Table 2).
Results (for PASI 100 Response) of a Frequentist NMA with Efficacy Data Through Week 48-52.40
| Treatment | Primary Analysis (8 Treatments) | Secondary Analysis (14 Treatments and Placebo) | ||||
|---|---|---|---|---|---|---|
| Probability PASI 100% | SUCRA % | Rank (95% CrI) | Probability PASI 100% | SUCRA % | Rank (95% CrI) | |
| Risankizumab 150mg | 61.1 | 97.3 | 1 (1-3) | 58.9 | 98.2 | 1 (1-3) |
| Brodalumab 210mg | 54.5 | 78.8 | 2 (1-4) | 53.3 | 89.2 | 2 (1-4) |
| Guselkumab 100mg | 54.2 | 78.2 | 3 (1-4) | 53.3 | 89.6 | 2 (1-4) |
| Ixekizumab 80mg | 46.1 | 57.1 | 4 (2-5) | 45.6 | 76.7 | 4 (3-7) |
| Secukinumab 300mg | 40.9 | 45.7 | 5 (4-5) | 40.6 | 67.9 | 5 (4-8) |
| Ustekinumab 45mg (<100kg) or 90mg (≥100kg) | 28.9 | 24.3 | 6 (6-7) | 27.8 | 40.3 | 9 (7-12) |
| Adalimumab 40mg | 26.4 | 18.4 | 7 (6-7) | 25.6 | 34.4 | 10 (7-12) |
| Etanercept 25mg | 16.8 | 0.1 | 8 (8-8) | 16.9 | 16.5 | 13 (11-13) |
| BIW/50mg QW | ||||||
Abbreviations: BIW, biweekly; QW, every week.
The primary analysis includes H2H RCTs up to the end of maintenance treatment; the secondary analysis assumes that the responses at the end of the phase compared with placebo persist through to the end of maintenance. Ranking by probability estimate of PASI 100 response compared with placebo, SUCRA, and ranking (95% CrI). In Fig. 6 of the corresponding publication (not displayed), a ranking plot of the secondary analysis is displayed, with the range (or rank number) on the abscissa and the SUCRA on the ordinate axis.40
A recent publication included all biologic agents currently approved in the European Union, studying both short-term outcomes (10-16 weeks) and at the end of the maintenance phase of the RCTs (44-60 weeks).41 Firstly, the authors undertook a systematic literature review according to the PRISMA guidelines,42 which included phase 2, 3, or 4 clinical trials in adult patients with moderate to severe psoriasis, with EMA-approved treatments and treatment regimens.
To compare the responses at 10-16 weeks, a Bayesian random-effects NMA with an ordinal model was undertaken; the response was adjusted for placebo response to take into account the heterogeneity of the RCTs.6 As a measure of treatment effect, the response rates were estimated using the posterior median (in the Bayesian sense) and the corresponding 95% CrI, as well as the NNT. Pairwise comparisons were also undertaken for the different treatments with risankizumab, ixekizumab, brodalumab, and guselkumab. The statistical package used was described in detail (R and WinBUGS, with noninformative a priori probabilities) and sensitivity analyses were performed excluding country-specific RCTs, including only phase 3 RCTs, and including additional conventional treatments.
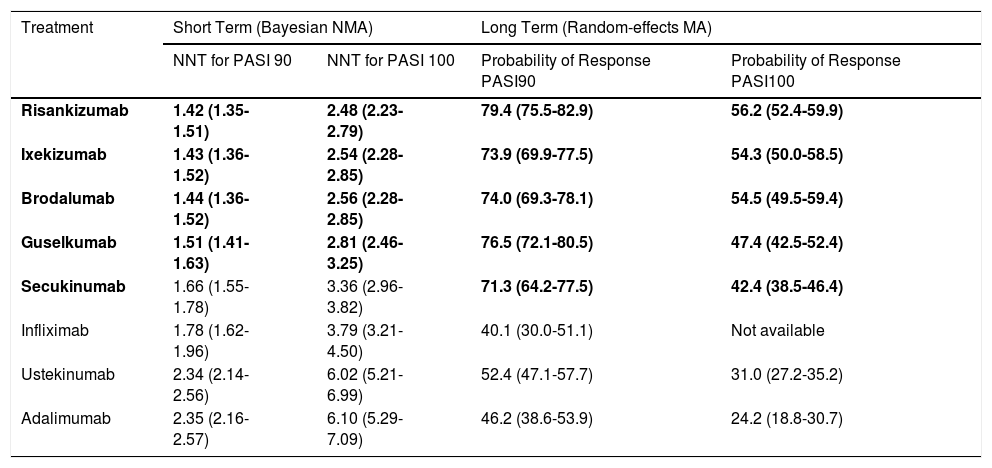
In the short term, risankizumab, ixekizumab, brodalumab, and guselkumab had significantly greater response rates than other treatments (including infliximab and secukinumab in all cases except guselkumab), without significant differences between the 4 treatments. The corresponding posterior medians for the response rates in the 4 treatments were greater than 85% for PASI 75, 66% for PASI 90, and 35% for PASI 100. The corresponding NNTs with their 95% CrIs are shown in Table 3. The results of the sensitivity analyses supported those of the main analysis.
Number of Patients Needed to Treat (NNT) to Achieve PASI 90 or PASI 100 Response (95% CI) in the Short Term (10-16 Weeks) and Probability of PASI 90 or PASI 100 Response (95% CI) in the Long Term (44-60 Weeks) Estimated With a Traditional Random-Effects MA for the Best Biologic Treatments.41
| Treatment | Short Term (Bayesian NMA) | Long Term (Random-effects MA) | ||
|---|---|---|---|---|
| NNT for PASI 90 | NNT for PASI 100 | Probability of Response PASI90 | Probability of Response PASI100 | |
| Risankizumab | 1.42 (1.35-1.51) | 2.48 (2.23-2.79) | 79.4 (75.5-82.9) | 56.2 (52.4-59.9) |
| Ixekizumab | 1.43 (1.36-1.52) | 2.54 (2.28-2.85) | 73.9 (69.9-77.5) | 54.3 (50.0-58.5) |
| Brodalumab | 1.44 (1.36-1.52) | 2.56 (2.28-2.85) | 74.0 (69.3-78.1) | 54.5 (49.5-59.4) |
| Guselkumab | 1.51 (1.41-1.63) | 2.81 (2.46-3.25) | 76.5 (72.1-80.5) | 47.4 (42.5-52.4) |
| Secukinumab | 1.66 (1.55-1.78) | 3.36 (2.96-3.82) | 71.3 (64.2-77.5) | 42.4 (38.5-46.4) |
| Infliximab | 1.78 (1.62-1.96) | 3.79 (3.21-4.50) | 40.1 (30.0-51.1) | Not available |
| Ustekinumab | 2.34 (2.14-2.56) | 6.02 (5.21-6.99) | 52.4 (47.1-57.7) | 31.0 (27.2-35.2) |
| Adalimumab | 2.35 (2.16-2.57) | 6.10 (5.29-7.09) | 46.2 (38.6-53.9) | 24.2 (18.8-30.7) |
The 4 significantly superior treatments according to the Bayesian NMA and the 5 according to the random-effects MA (pairwise comparison of ORs) are highlighted in boldface; data corresponding to other treatments are included for comparison.
The analysis of long-term efficacy was hindered by patients crossing over to a different treatment arm and the selection of responders; several RCTs were therefore excluded. Only 22 RCTs were included and a traditional random-effects MA was performed to estimate PASI 75, PASI 90, and PASI 100 response rates, making pairwise comparisons with risankizumab, ixekizumab, brodalumab, and guselkumab, and calculating the respective OR and 95% CIs. Sensitivity analyses were performed excluding country-specific RCTs, including only phase 3 RCTs, and including only RCTs with non-response imputation (NRI).
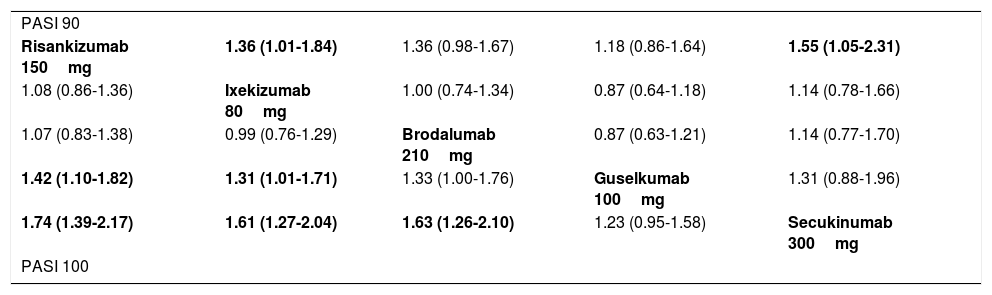
The PASI 90 and PASI 100 response rates at 44-60 weeks estimated in the random-effects MA are shown in Table 3. In Table 4, the pairwise comparisons (OR) between the 5 treatments with greatest response in the long term are shown (data from Fig. 2 of the original publication).41
League Table Summarizing the Results of Pairwise Indirect Comparisons (ITCs) for the Different Treatments in the Random-Effects MA for Long-Term Results (44-60 Weeks).41
| PASI 90 | ||||
| Risankizumab 150mg | 1.36 (1.01-1.84) | 1.36 (0.98-1.67) | 1.18 (0.86-1.64) | 1.55 (1.05-2.31) |
| 1.08 (0.86-1.36) | Ixekizumab 80mg | 1.00 (0.74-1.34) | 0.87 (0.64-1.18) | 1.14 (0.78-1.66) |
| 1.07 (0.83-1.38) | 0.99 (0.76-1.29) | Brodalumab 210mg | 0.87 (0.63-1.21) | 1.14 (0.77-1.70) |
| 1.42 (1.10-1.82) | 1.31 (1.01-1.71) | 1.33 (1.00-1.76) | Guselkumab 100mg | 1.31 (0.88-1.96) |
| 1.74 (1.39-2.17) | 1.61 (1.27-2.04) | 1.63 (1.26-2.10) | 1.23 (0.95-1.58) | Secukinumab 300mg |
| PASI 100 | ||||
Data are provided as estimated OR (95% CI).
In the lower triangle (PASI 100), the effect estimate (efficacy) is the estimated OR of the treatment defined by the column with respect to that defined by the row; if the 95% CI does not include 1, OR>1 favors the treatment defined in the column, OR<1 favors treatment defined by the row.
In the upper triangle (PASI 90), the effect estimate (efficacy) is the estimated OR for treatment defined by the row with respect to the treatment defined by the column. If the 95% CI does not include 1, OR>1 favors the treatment defined by the row, OR<1 favors the treatment defined by the column. Significant comparisons are highlighted in boldface.
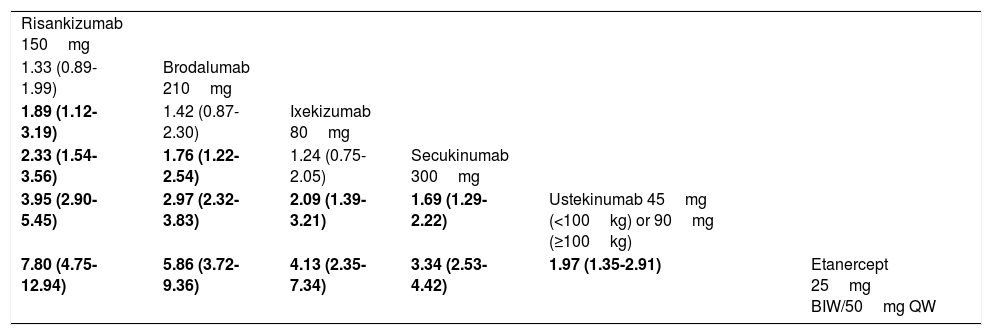
In order to assess whether the MA43 could have an impact on the results, a fixed-effects Bayesian NMA was performed, including RCTs that maintained randomized treatment through week 52 (7 RCTs corresponding to 6 treatments). The corresponding network diagram obtained from data in the original publication is shown in Fig. 6. Table 5 shows the detailed league table of pairwise comparisons (OR) of this NMA.

Network diagram of Bayesian fixed-effects NMA performed with RCTs that maintained randomized treatment through week 52.
Extracted from Armstrong et al.41
League Table Summarizing the Resulting OR (95% CrI) From Pairwise Comparisons of Treatments in a Fixed-Effects Bayesian NMA of PASI 90 Reponses at 52 Weeks.41
| Risankizumab 150mg | |||||
| 1.33 (0.89-1.99) | Brodalumab 210mg | ||||
| 1.89 (1.12-3.19) | 1.42 (0.87-2.30) | Ixekizumab 80mg | |||
| 2.33 (1.54-3.56) | 1.76 (1.22-2.54) | 1.24 (0.75-2.05) | Secukinumab 300mg | ||
| 3.95 (2.90-5.45) | 2.97 (2.32-3.83) | 2.09 (1.39-3.21) | 1.69 (1.29-2.22) | Ustekinumab 45mg (<100kg) or 90mg (≥100kg) | |
| 7.80 (4.75-12.94) | 5.86 (3.72-9.36) | 4.13 (2.35-7.34) | 3.34 (2.53-4.42) | 1.97 (1.35-2.91) | Etanercept 25mg BIW/50mg QW |
Abbreviations: BIW, biweekly; CrI, credibility interval; QW, every week. Data are provided as estimated OR (95% CrI). The effect estimate (efficacy) is the estimated OR of the treatment defined by the column with respect to that defined by the row; if the 95% CrI does not include 1, OR>1 favors the treatment defined in the column, OR<1 favors the treatment defined in the row. Significant comparisons are highlighted in boldface.
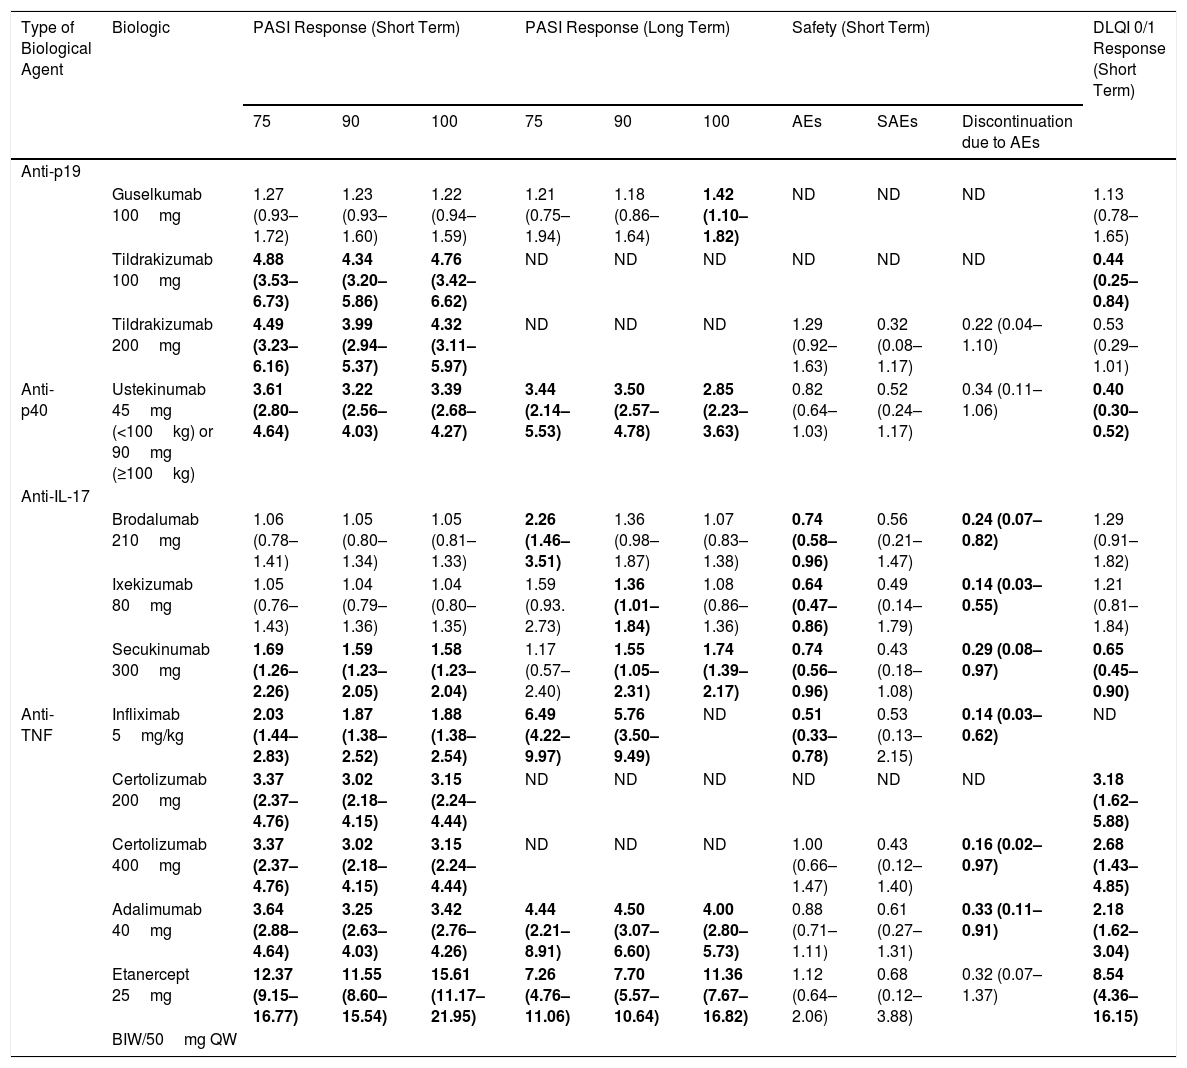
The results of this NMA41 can be complemented with the corresponding safety results (SAEs and discontinuations due to AEs in the RCTs) and the impact on quality of life (percentage with DLQI 0/1 response) at the end of induction or the time of assessment of the primary efficacy endpoint in the RCTs (week 12-16), which have been presented as poster in the World Congress of Dermatology in Milan, Italy, in 2019 (Shear et al. Poster 6284) and the 28th Congress of the European Academy of Dermatology and Venereology in Madrid in 2019 (Warren RB, et al. Poster 1716). The results of these pairwise comparisons of risankizumab with the other drugs are shown in Table 6.
Table Summarizing the Indirect Comparisons of Risankizumab 150mg With Other Biologics for the Treatment of Moderate to Severe Plaque Psoriasis Determined in the NMA Described by Armstrong et al.41 and in Posters Based on the Same Analysis.
| Type of Biological Agent | Biologic | PASI Response (Short Term) | PASI Response (Long Term) | Safety (Short Term) | DLQI 0/1 Response (Short Term) | ||||||
|---|---|---|---|---|---|---|---|---|---|---|---|
| 75 | 90 | 100 | 75 | 90 | 100 | AEs | SAEs | Discontinuation due to AEs | |||
| Anti-p19 | |||||||||||
| Guselkumab 100mg | 1.27 (0.93–1.72) | 1.23 (0.93–1.60) | 1.22 (0.94–1.59) | 1.21 (0.75–1.94) | 1.18 (0.86–1.64) | 1.42 (1.10–1.82) | ND | ND | ND | 1.13 (0.78–1.65) | |
| Tildrakizumab 100mg | 4.88 (3.53–6.73) | 4.34 (3.20–5.86) | 4.76 (3.42–6.62) | ND | ND | ND | ND | ND | ND | 0.44 (0.25–0.84) | |
| Tildrakizumab 200mg | 4.49 (3.23–6.16) | 3.99 (2.94–5.37) | 4.32 (3.11–5.97) | ND | ND | ND | 1.29 (0.92–1.63) | 0.32 (0.08–1.17) | 0.22 (0.04–1.10) | 0.53 (0.29–1.01) | |
| Anti-p40 | Ustekinumab 45mg (<100kg) or 90mg (≥100kg) | 3.61 (2.80–4.64) | 3.22 (2.56–4.03) | 3.39 (2.68–4.27) | 3.44 (2.14–5.53) | 3.50 (2.57–4.78) | 2.85 (2.23–3.63) | 0.82 (0.64–1.03) | 0.52 (0.24–1.17) | 0.34 (0.11–1.06) | 0.40 (0.30–0.52) |
| Anti-IL-17 | |||||||||||
| Brodalumab 210mg | 1.06 (0.78–1.41) | 1.05 (0.80–1.34) | 1.05 (0.81–1.33) | 2.26 (1.46–3.51) | 1.36 (0.98–1.87) | 1.07 (0.83–1.38) | 0.74 (0.58–0.96) | 0.56 (0.21–1.47) | 0.24 (0.07–0.82) | 1.29 (0.91–1.82) | |
| Ixekizumab 80mg | 1.05 (0.76–1.43) | 1.04 (0.79–1.36) | 1.04 (0.80–1.35) | 1.59 (0.93. 2.73) | 1.36 (1.01–1.84) | 1.08 (0.86–1.36) | 0.64 (0.47–0.86) | 0.49 (0.14–1.79) | 0.14 (0.03–0.55) | 1.21 (0.81–1.84) | |
| Secukinumab 300mg | 1.69 (1.26–2.26) | 1.59 (1.23–2.05) | 1.58 (1.23–2.04) | 1.17 (0.57–2.40) | 1.55 (1.05–2.31) | 1.74 (1.39–2.17) | 0.74 (0.56–0.96) | 0.43 (0.18–1.08) | 0.29 (0.08–0.97) | 0.65 (0.45–0.90) | |
| Anti-TNF | Infliximab 5mg/kg | 2.03 (1.44–2.83) | 1.87 (1.38–2.52) | 1.88 (1.38–2.54) | 6.49 (4.22–9.97) | 5.76 (3.50–9.49) | ND | 0.51 (0.33–0.78) | 0.53 (0.13–2.15) | 0.14 (0.03–0.62) | ND |
| Certolizumab 200mg | 3.37 (2.37–4.76) | 3.02 (2.18–4.15) | 3.15 (2.24–4.44) | ND | ND | ND | ND | ND | ND | 3.18 (1.62–5.88) | |
| Certolizumab 400mg | 3.37 (2.37–4.76) | 3.02 (2.18–4.15) | 3.15 (2.24–4.44) | ND | ND | ND | 1.00 (0.66–1.47) | 0.43 (0.12–1.40) | 0.16 (0.02–0.97) | 2.68 (1.43–4.85) | |
| Adalimumab 40mg | 3.64 (2.88–4.64) | 3.25 (2.63–4.03) | 3.42 (2.76–4.26) | 4.44 (2.21–8.91) | 4.50 (3.07–6.60) | 4.00 (2.80–5.73) | 0.88 (0.71–1.11) | 0.61 (0.27–1.31) | 0.33 (0.11–0.91) | 2.18 (1.62–3.04) | |
| Etanercept 25mg | 12.37 (9.15–16.77) | 11.55 (8.60–15.54) | 15.61 (11.17–21.95) | 7.26 (4.76–11.06) | 7.70 (5.57–10.64) | 11.36 (7.67–16.82) | 1.12 (0.64–2.06) | 0.68 (0.12–3.88) | 0.32 (0.07–1.37) | 8.54 (4.36–16.15) | |
| BIW/50mg QW | |||||||||||
The data are estimated ORs (95% CI); PASI 75, PASI 90, and PASI 100 response rates from Fig. 1 and Fig. 2 of the supplementary online content41; safety data from Fig. 2 of Poster 6285 presented at the World Congress of Dermatology, Milan, 2019 (Shear NH et al. Comparison of safety outcomes for treatments of moderate to severe plaque psoriasis through a network meta-analysis); DLQI 0/1 response rates from Table 1 of Poster 1716 presented at the 28th Congress of the European Academy of Dermatology and Venereology in Madrid in 2019 (Warren RB, et al. Comparison of dermatology quality of life index for novel treatments of moderate-to-severe plaque psoriasis: a network meta-analysis). In boldface, significant results (P<.05) based on 95% CI.
Abbreviations: adverse events, AE; ND, not determined; SAE, serious adverse events.
When there is an imbalance in known modifiers (covariates) of the treatment effect and individual patient data are available, MAICs may be preferable to ITCs and NMAs, reducing bias. A recent MAIC that serves as an example compares the efficacy of ixekizumab and secukinumab44 using individual patient data from treatment with ixekizumab in RCTs that used placebo, etanercept, or ustekinumab as comparators, adjusting them (removing cases from the analysis or weighting their representation in the treatment arm) for certain covariates such as baseline weight, duration of psoriasis, or prior systemic treatment. An ITC was then performed, anchored using the Bucher method using the effect measures (risk difference and OR) resulting from the adjustment of the individual data from ixekizumab to the aggregate data from the RCTs of secukinumab for each of the comparisons (placebo, etanercept, and ustekinumab). A series of MAICs and ITCs were performed for each comparison; as 2 results were obtained (that is, via etanercept and via ustekinumab) for each indirect comparison of ixekizumab with secukinumab, the authors performed an MA of these results with a fixed-effects model.44
Indirect Patient Data (IPD) ComparisonsIn another publication, an indirect comparison of guselkumab was performed with ustekinumab using IPD from different RCTs with the same sponsor and adjusting for differences in covariates using a multivariate regression model.45 This publication also illustrates the potential limitations of the inclusion of RCTs with arms in which there is a partial unblinding or enrichment of a given arm because of switching following prior response, but the sensitivity analyses supported the results obtained.
ConclusionThe use of traditional MAs and NMAs (frequentist and Bayesian) incorporates information from RCTs and enables indirect and mixed comparisons of efficacy between different treatments, providing a ranking. When interpreting and comparing the results from different MAs and NMAs, it is important to keep in mind the methodology used and the design of the studies included in the comparison. With all the limitations inherent in the extrapolation of RCTs to clinical practice settings, these results may be useful for clinicians and regulatory or reimbursement agencies, as illustrated by the example of moderate to severe psoriasis. Based on the different NMAs, the 4 most effective treatments (in terms of PASI 90 and PASI 100 response) both in the short term (10-16 weeks of treatment) and long term (approximately 1 year of treatment) are risankizumab, brodalumab, ixekizumab, and guselkumab, in this order approximately, although the differences between them are not always significant.
Conflicts of InterestDr. L. Puig has received consultant and/or speaker fees from Abbvie®, Almirall®, Amgen®, Baxalta®, Biogen®, Boehringer Ingelheim®, Celgene®, Fresenius-Kabi®, Gebro®, Janssen®, JS BIOCAD®, Leo-Pharma®, Lilly®, Merck-Serono®, MSD®, Mylan®, Novartis®, Pfizer®, Regeneron®, Roche®, Sandoz®, Samsung-Bioepis®, Sanofi®, UCB®. He has also participated in clinical trials sponsored by: Abbvie®, Almirall®, Amgen®, Boehringer Ingelheim®, Celgene®, Janssen®, Leo-Pharma®, Lilly®, Novartis®, Pfizer®, Regeneron®, Roche®, Sanofi®, and UCB®.
Please cite this article as: Puig L. Metaanálisis y comparaciones indirectas. Métodos y paradigma: tratamiento biológico de la psoriasis. Actas Dermosifiliogr. 2021;112:203–215.


